Other
GOOG Stock Analysis Financial Model
Original price was: $29.99.$19.99Current price is: $19.99.
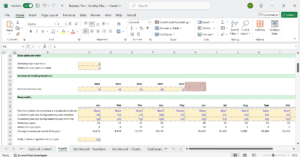
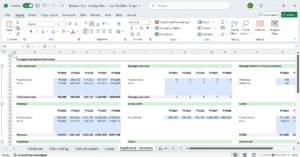
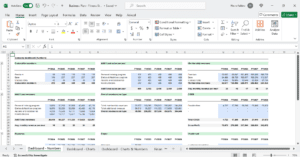
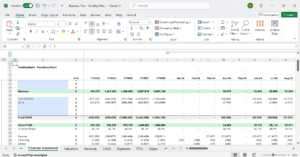
Unlock the full potential of your investment analysis with this comprehensive Excel template for GOOG stock. This powerful tool features historical financial data, balance sheets, income statements, and cash flow statements organized by quarter and year for detailed trend analysis. Dive deeper with financial ratio analysis, EPS projections, and a robust discounted cash flow (DCF) model to estimate intrinsic value. Additionally, explore a complete company profile that includes descriptions, contact details, and analysts’ stock price projections. Designed with dynamic charts, intuitive layouts, and customizable inputs, this template is perfect for investors, analysts, and students looking to make informed decisions with ease and efficiency.
Excel Template for Comprehensive Analysis of GOOG Stock
Are you an investor or analyst looking for a powerful, easy-to-use tool to evaluate Google (GOOG) stock? Look no further. Our GOOG Stock Analysis Financial Model is your all-in-one solution for performing a detailed financial analysis, understanding historical trends, and projecting future performance—all in a user-friendly format.
Why Choose This Template?
- Save Time: Skip the hassle of gathering and organizing data.
- Gain Insights: Dive deep into Google’s financials with clean, structured data.
- Make Informed Decisions: Use professional-grade tools for financial ratio analysis and discounted cash flow (DCF) projections.
How to Use the Template
- Download and Open: Compatible with all versions of Microsoft Excel.
- Input Data: The template comes pre-filled with GOOG’s latest data. Update it regularly to keep your analysis current.
- Analyze and Interpret: Use the organized sections and pre-built formulas to extract insights effortlessly.
Get Started Today
Maximize your investment potential with this all-in-one Excel template for analyzing GOOG stock. Download it now and gain access to:
- Comprehensive financial data.
- Professional-grade analysis tools.
- Easy-to-read, actionable insights.
Don’t miss out on this essential tool for smarter investing in Google stock and download our GOOG Stock Analysis Financial Model!
Find additional templates here.
What’s Included in the Template?
1. Historical Fundamental Data
- Easily access Google’s key financial metrics.
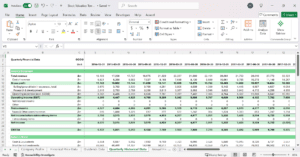
- Data is organized by quarter and by year, allowing you to track performance trends over time.
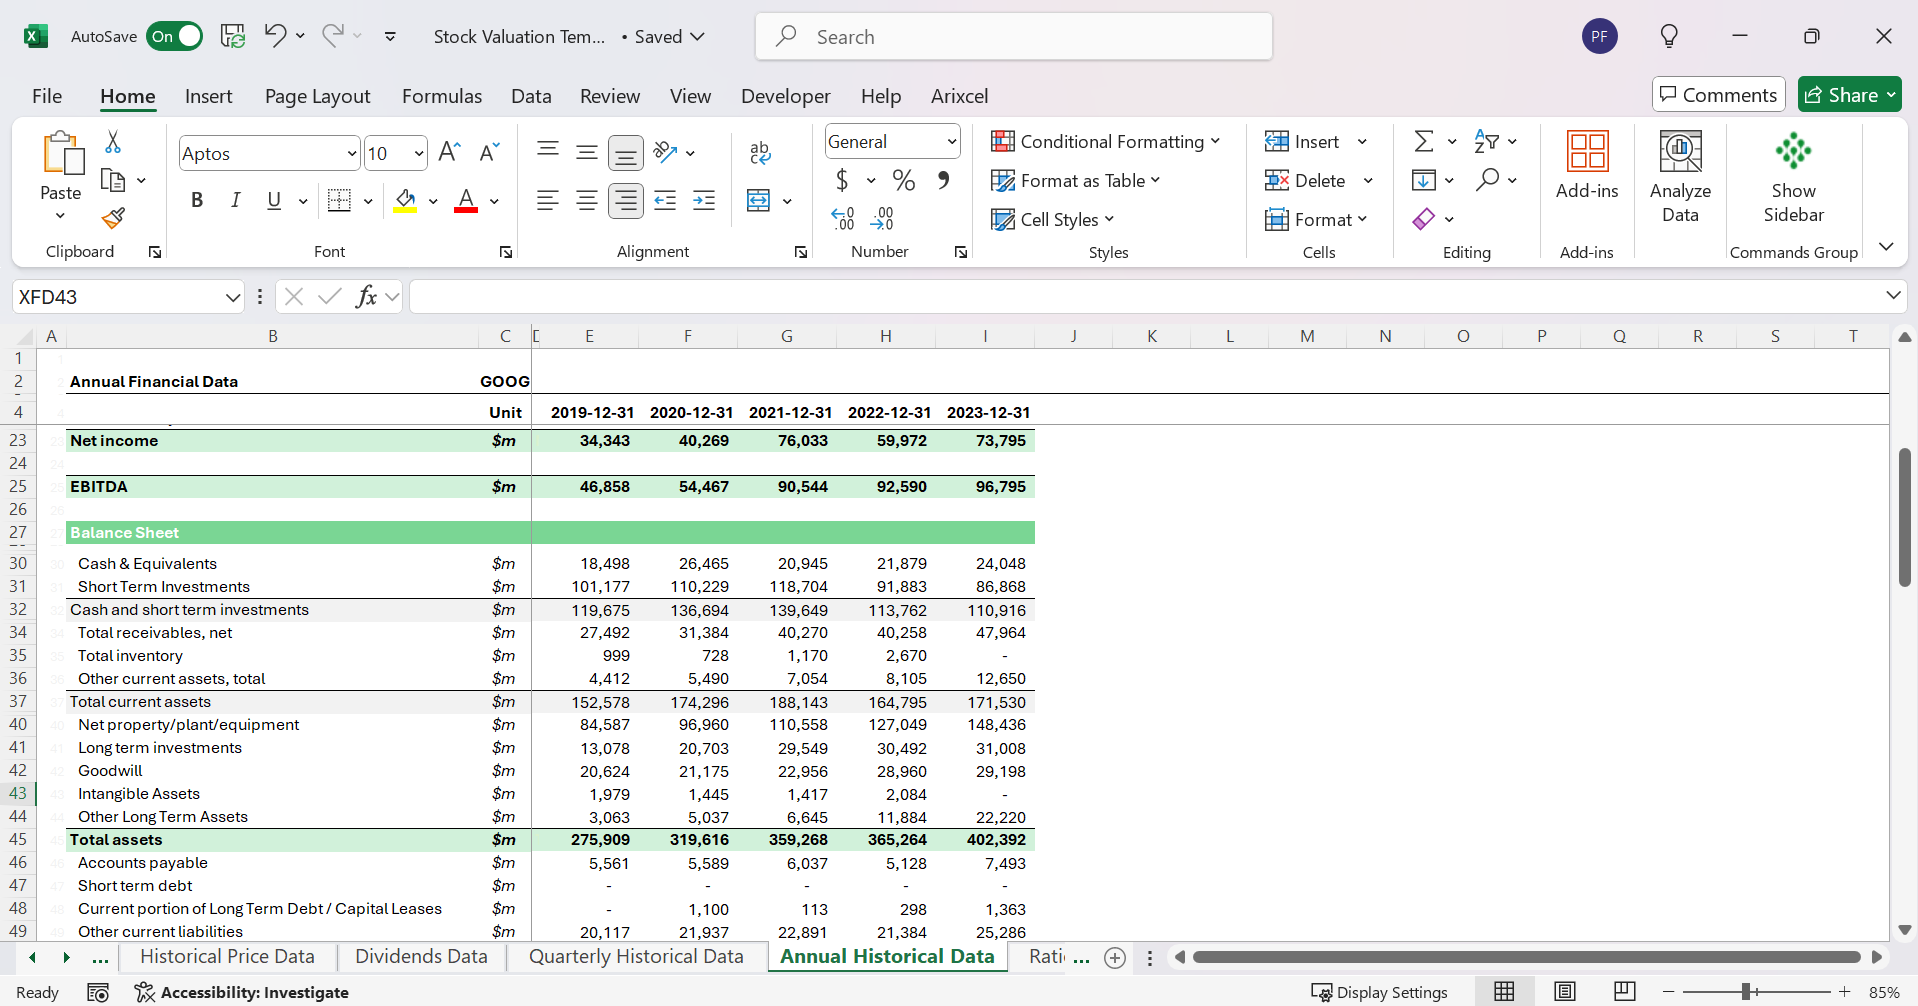
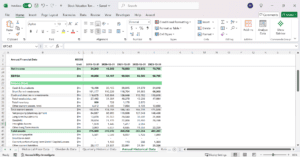
2. Balance Sheet
- A clear breakdown of assets, liabilities, and equity.
- Simplified layout to help you analyze financial stability.
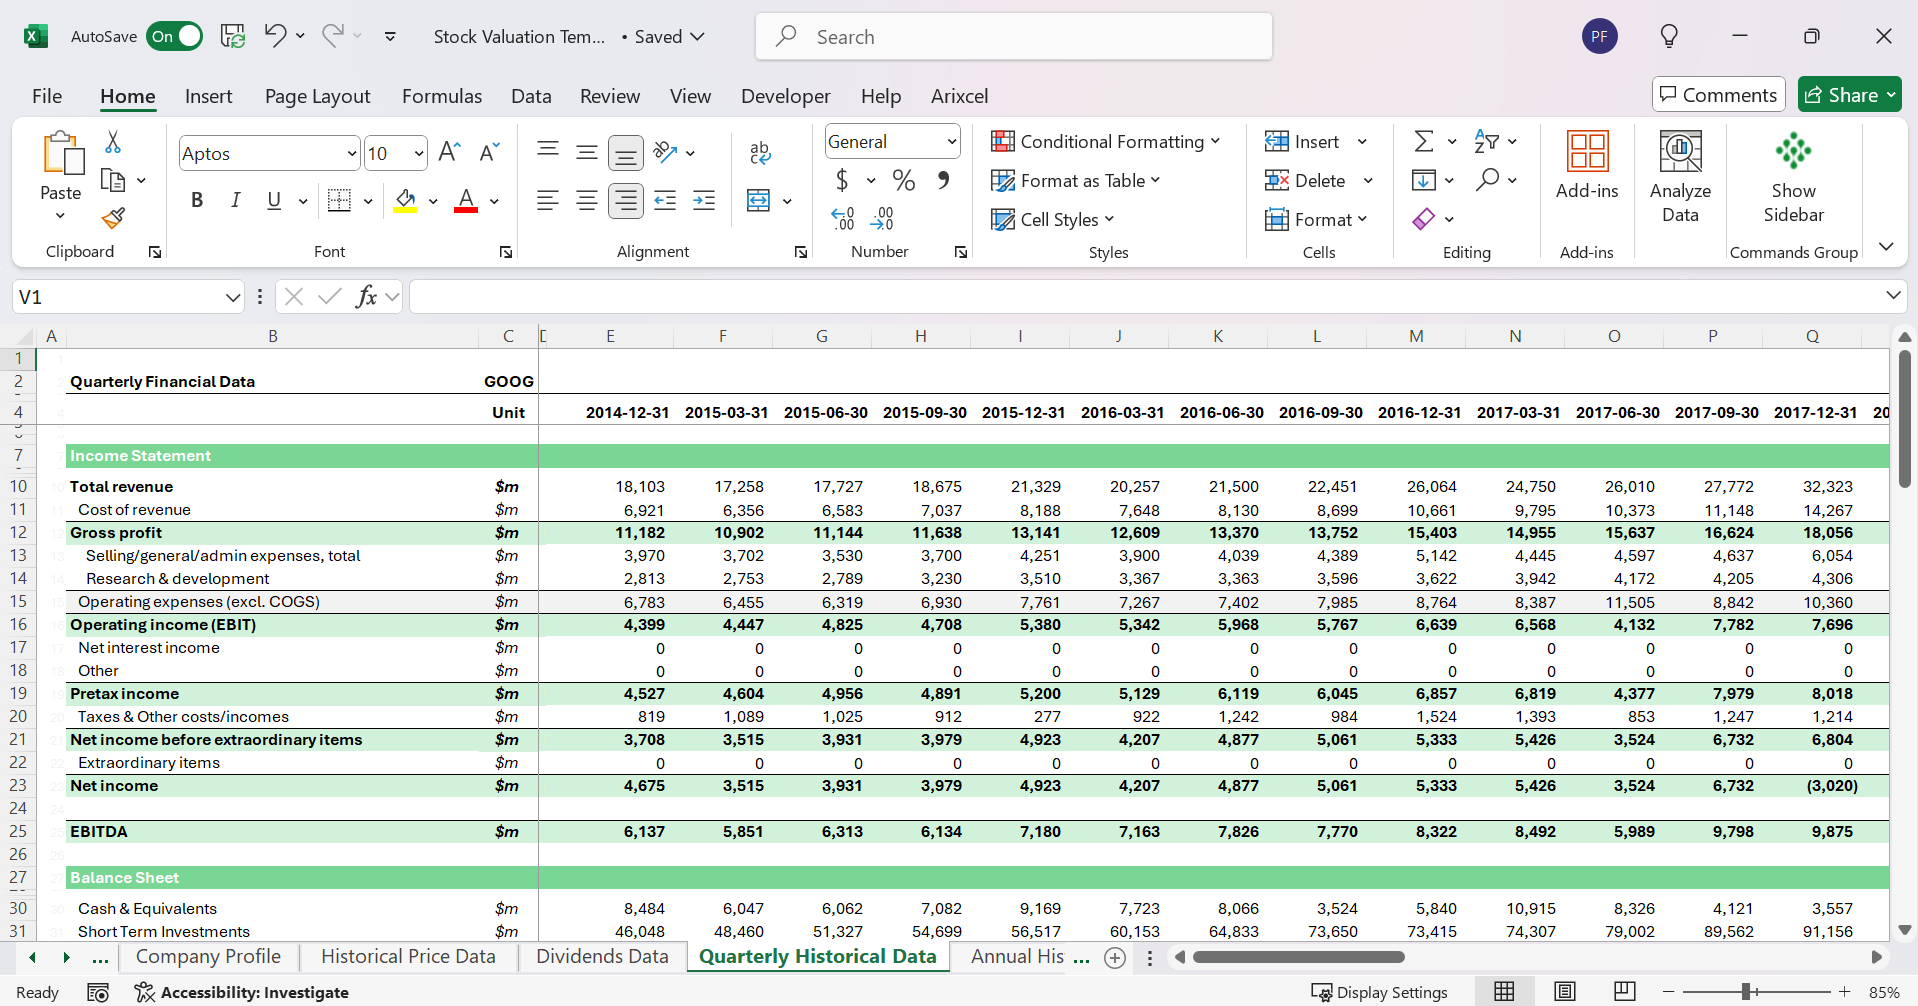
3. Income Statement
- Revenue, costs, and profits laid out in an intuitive format.
- Quarterly and annual views for comprehensive analysis.
4. Cash Flow Statement
- Understand Google’s cash inflows and outflows.
- Data segmented into operating, investing, and financing activities.
5. Dividend History
- Track dividend payments and yields over time.
- Useful for income-focused investors.
6. Price Data
- Historical stock prices for GOOG.
- Insights into price trends and volatility.
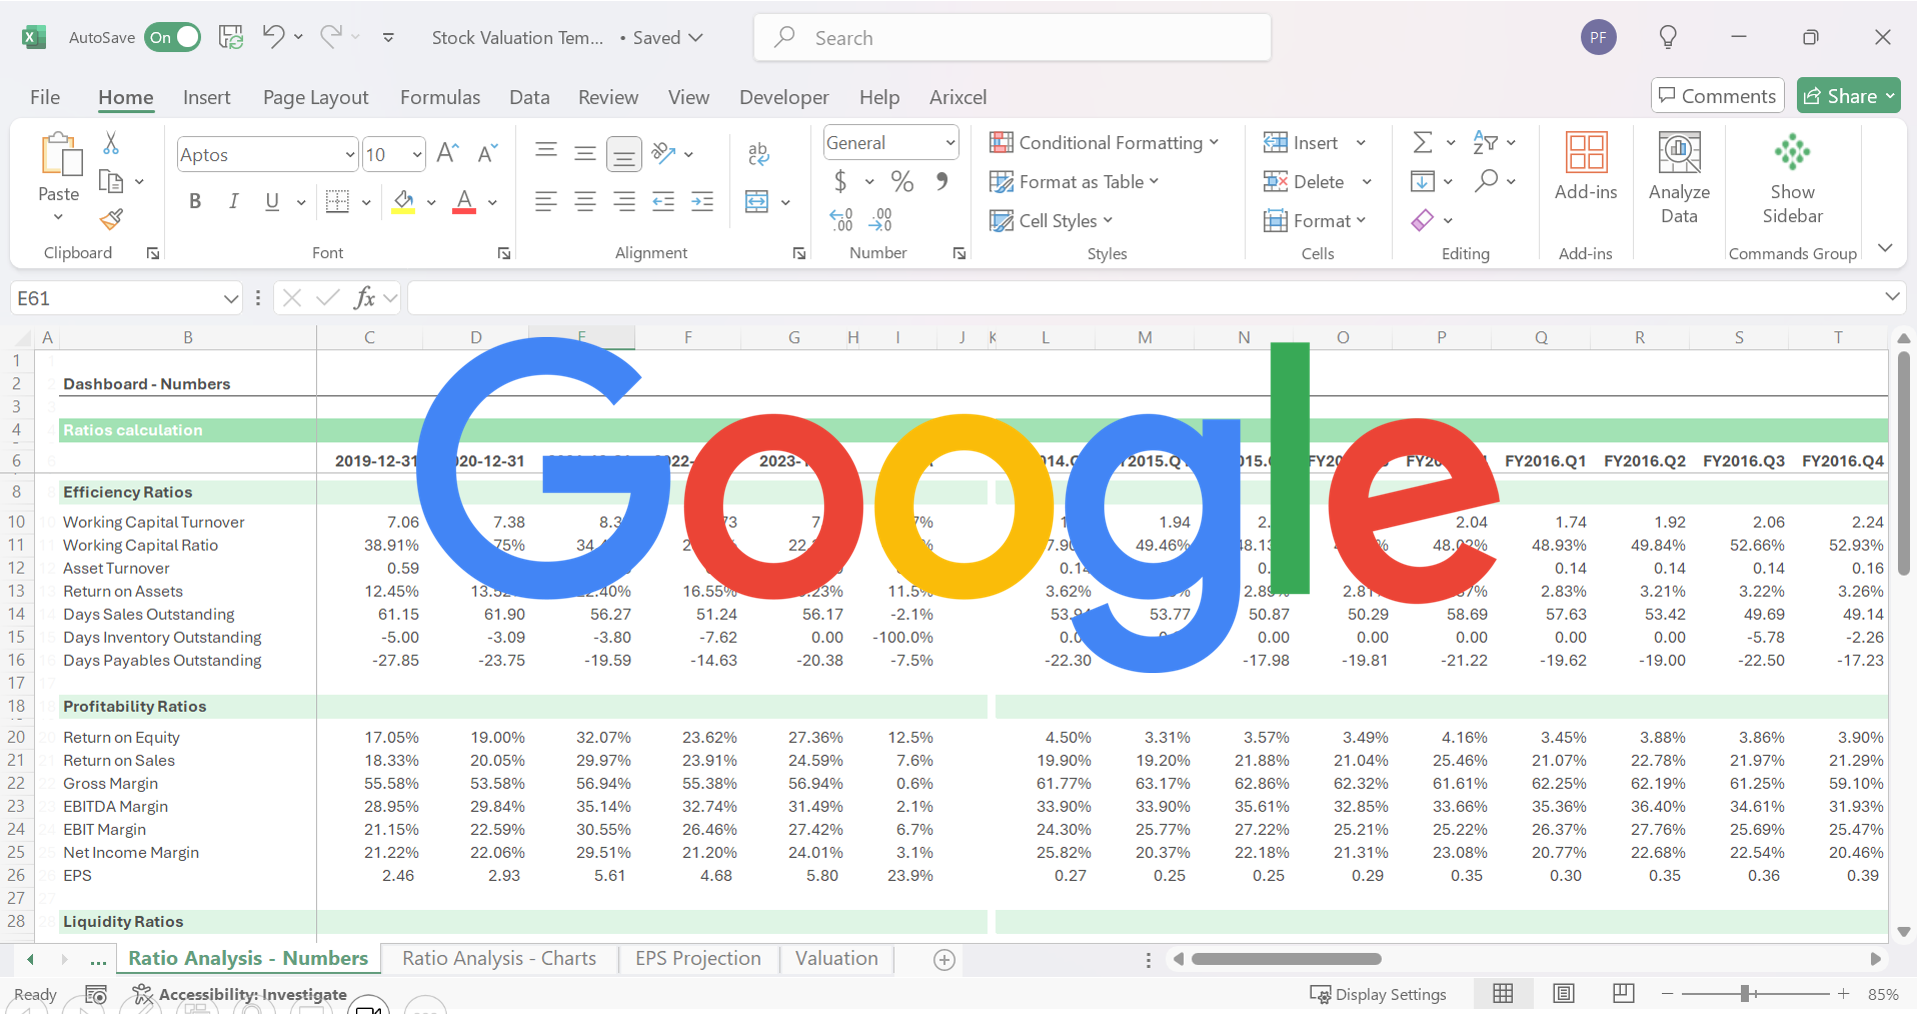
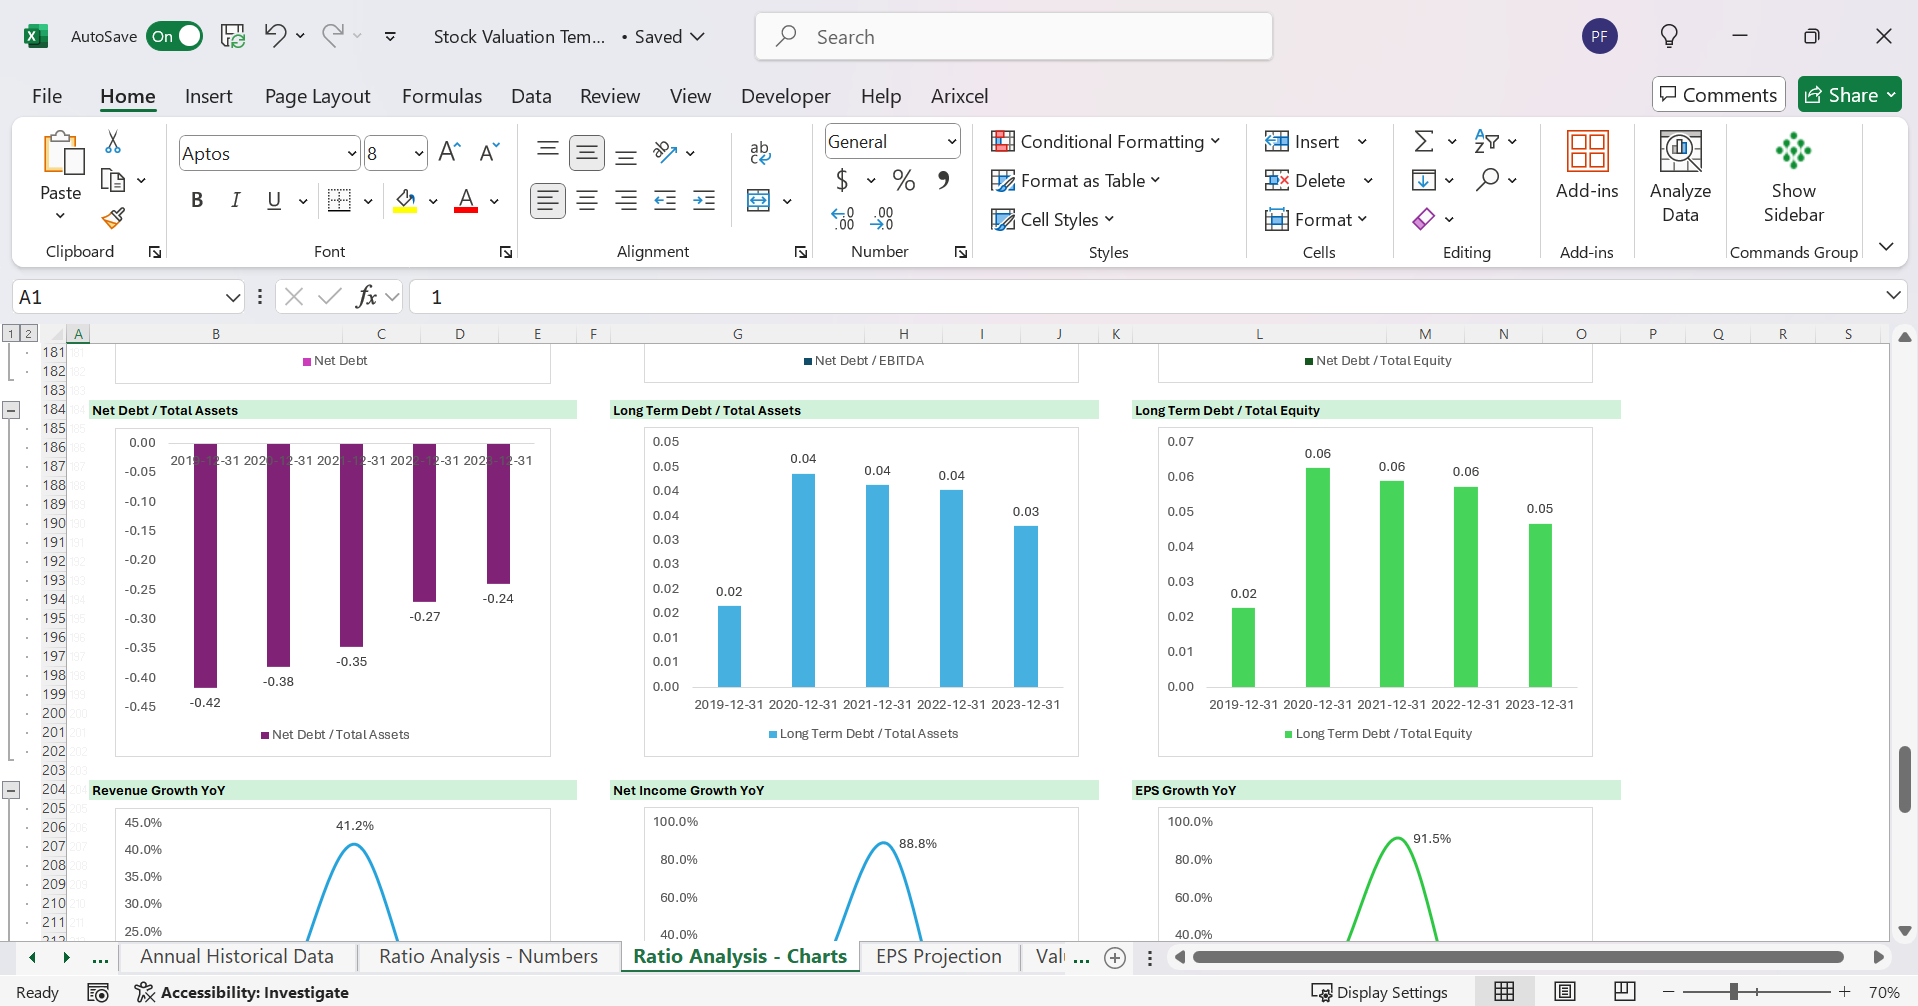
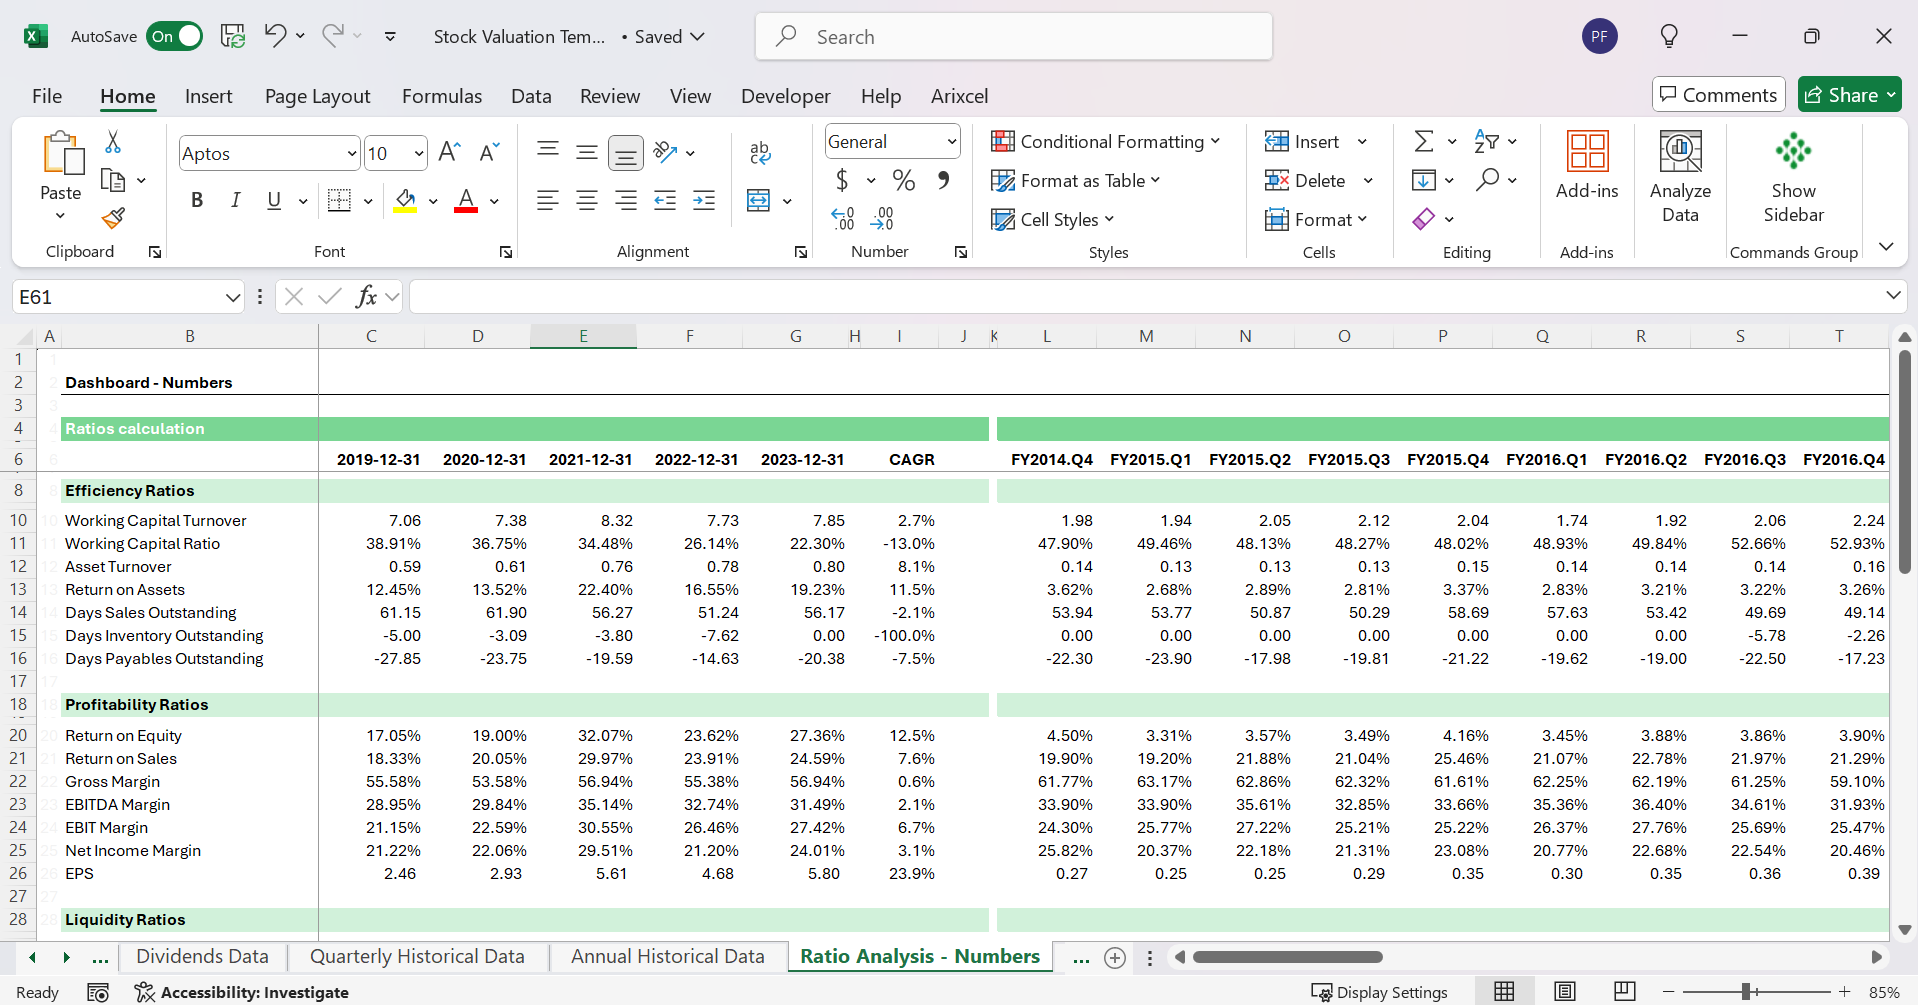
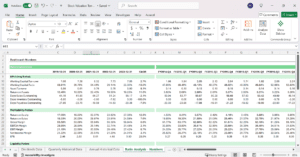
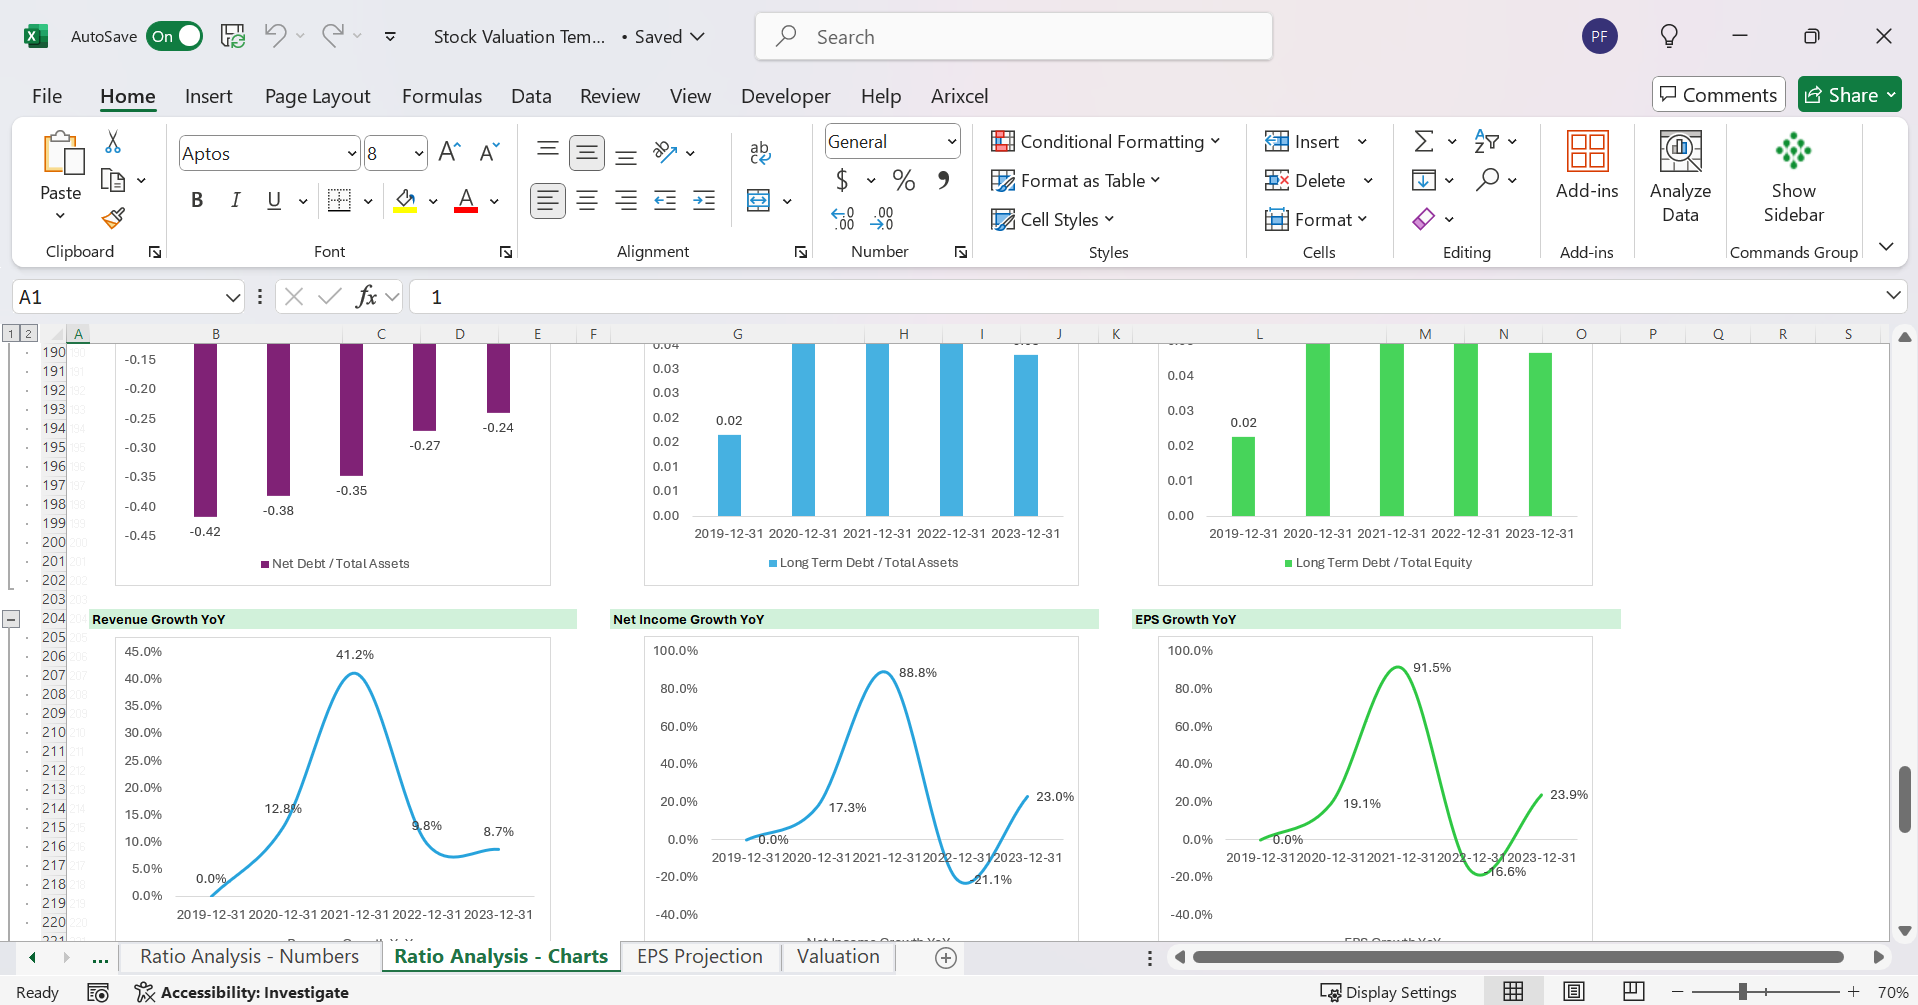
7. Financial Ratio Analysis
- Key ratios like P/E, ROE, and debt-to-equity are calculated for you.
- Comprehensive set of financial rations (efficiency, profitability, liquidity, solvency, growth ratios)
- Benchmark against industry standards to gauge performance.
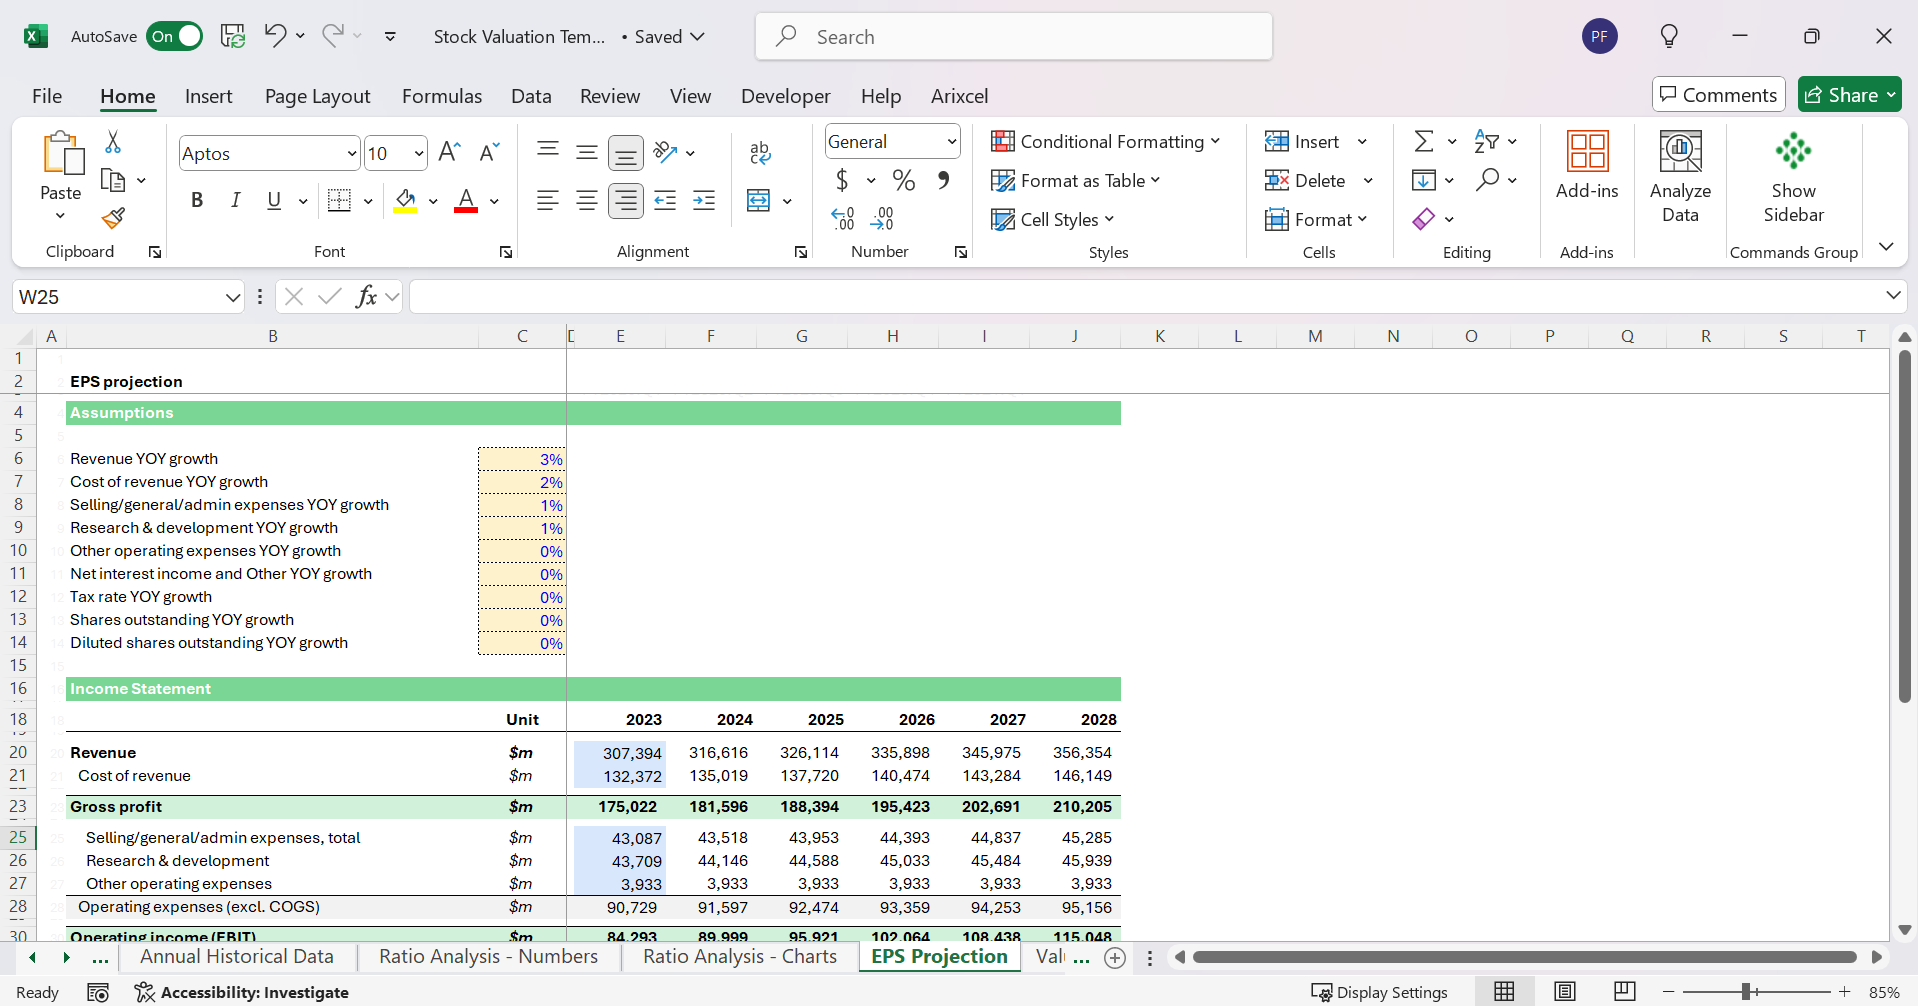
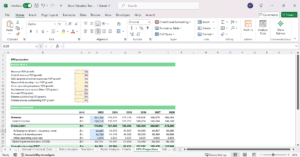
8. EPS Projections
- Tools to project future earnings per share based on historical trends.
- Use these projections to anticipate stock performance.
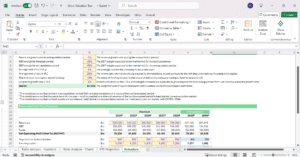
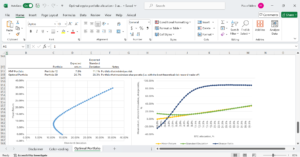
9. Discounted Cash Flow (DCF) Model
- A robust DCF analysis to estimate the intrinsic value of GOOG stock.
- Easily modify inputs like discount rate and growth assumptions to customize the model.
10. Company Profile
- Detailed company description and overview.
- Contact information for corporate offices.
- Analysts’ stock price projections to provide future valuation insights.
- User-Friendly Design: Intuitive layouts ensure easy navigation and readability.
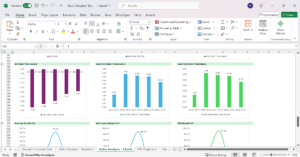
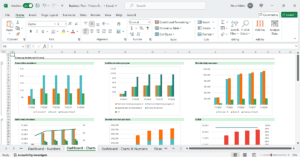
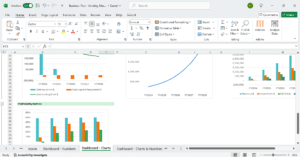
- Dynamic Charts: Visualize key metrics and trends with automatically generated graphs.
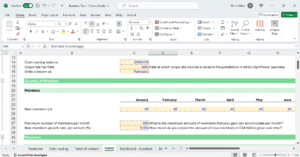
- Customizable Inputs: Tailor the template to fit your analysis needs.
- Individual investors analyzing Google stock for potential investment.
- Financial analysts preparing detailed reports on GOOG.
- Business students learning financial analysis techniques.
So much More
What’s Included?
Watch the Tutorial
Related Products
Reviewed by experts from leading organizations


