
NEW

Other
Financial Statement Analysis Financial Model – 5 Years
$29.99
Our customizable Financial Statement Analysis template calculates key financial ratios and generates insightful charts over a 5-year period, providing a detailed assessment of your company’s financial health. Ideal for strategic planning, investment evaluation, and reporting, this template features clear, professional formatting, enabling you to confidently present your company’s financial performance to investors or stakeholders.
Description
Find additional templates here.
Key Features
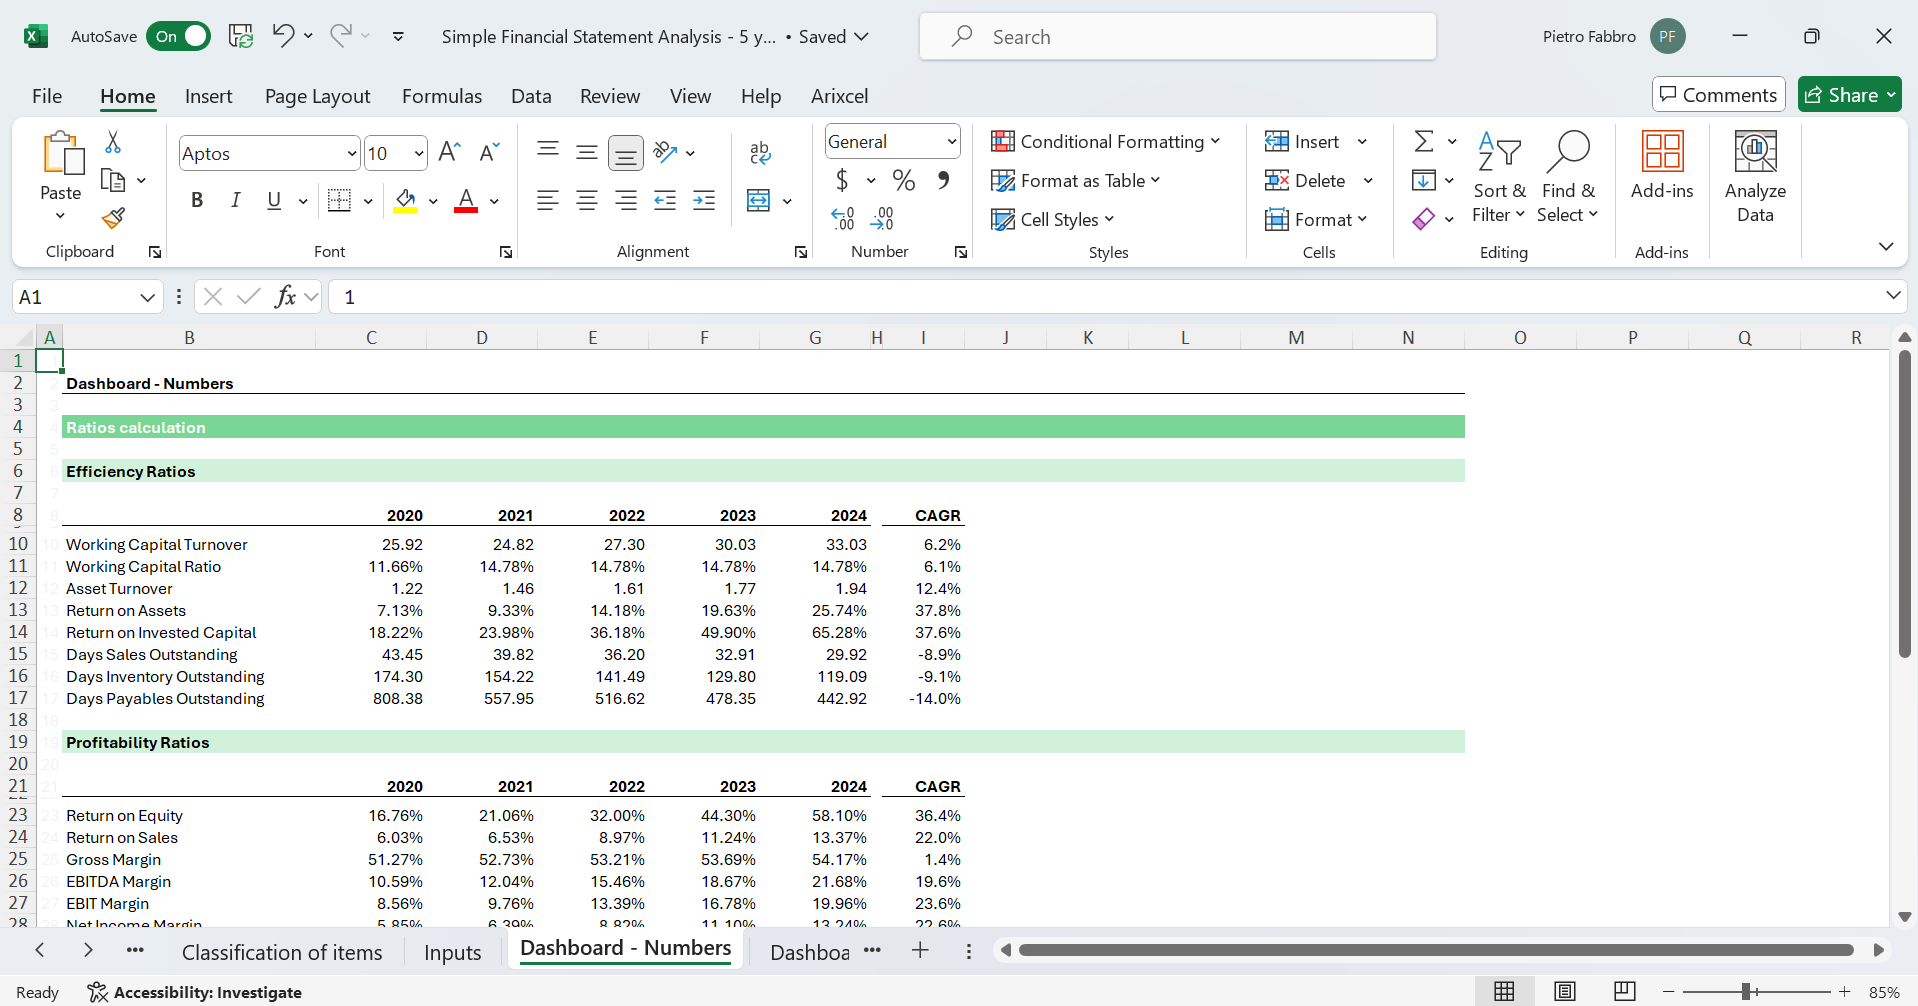
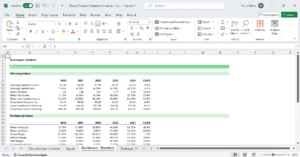
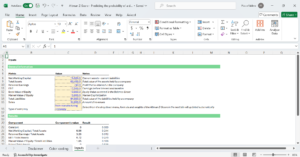
- Comprehensive Ratio Analysis: Automatically calculate a wide range of financial ratios that give you a detailed understanding of your company’s performance:
- Efficiency Ratios: Analyze how effectively your company uses its assets and manages liabilities. Metrics such as inventory turnover, accounts receivable turnover, and asset turnover are included to assess operational efficiency.
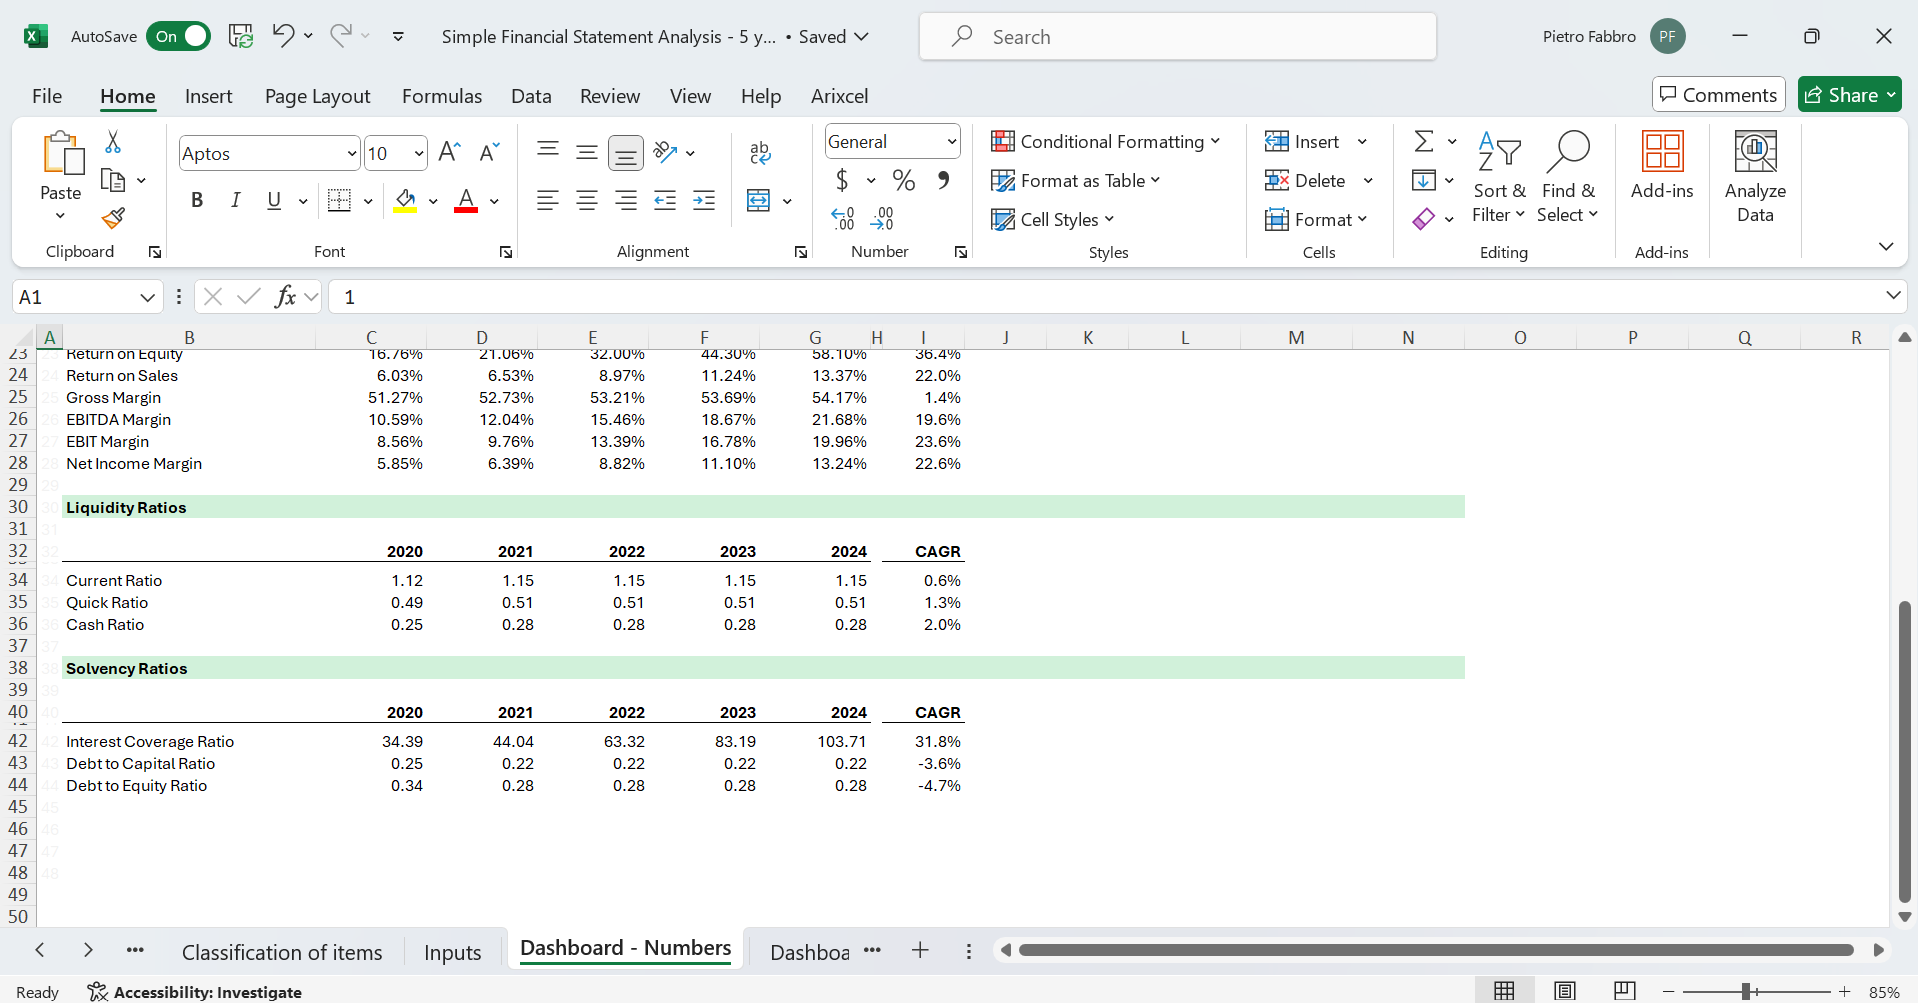
- Liquidity Ratios: Evaluate your company’s ability to meet short-term obligations with ratios like the current ratio, quick ratio, and cash ratio. These indicators are crucial for assessing financial stability.
- Profitability Ratios: Measure your company’s ability to generate profit relative to revenue, assets, and equity. Ratios like net profit margin, return on assets (ROA), and return on equity (ROE) help you understand overall financial performance.
- Solvency Ratios: Assess your company’s long-term financial viability and debt management with ratios such as debt-to-equity, interest coverage, and equity multiplier. These ratios provide insights into your company’s capital structure and ability to meet long-term obligations.
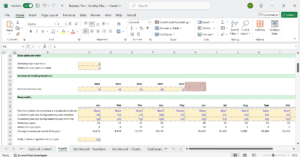
- 5-Year Time Frame: Track and compare your company’s financial performance over a 5-year period. This feature allows you to identify trends, monitor progress, and make informed decisions based on historical data.
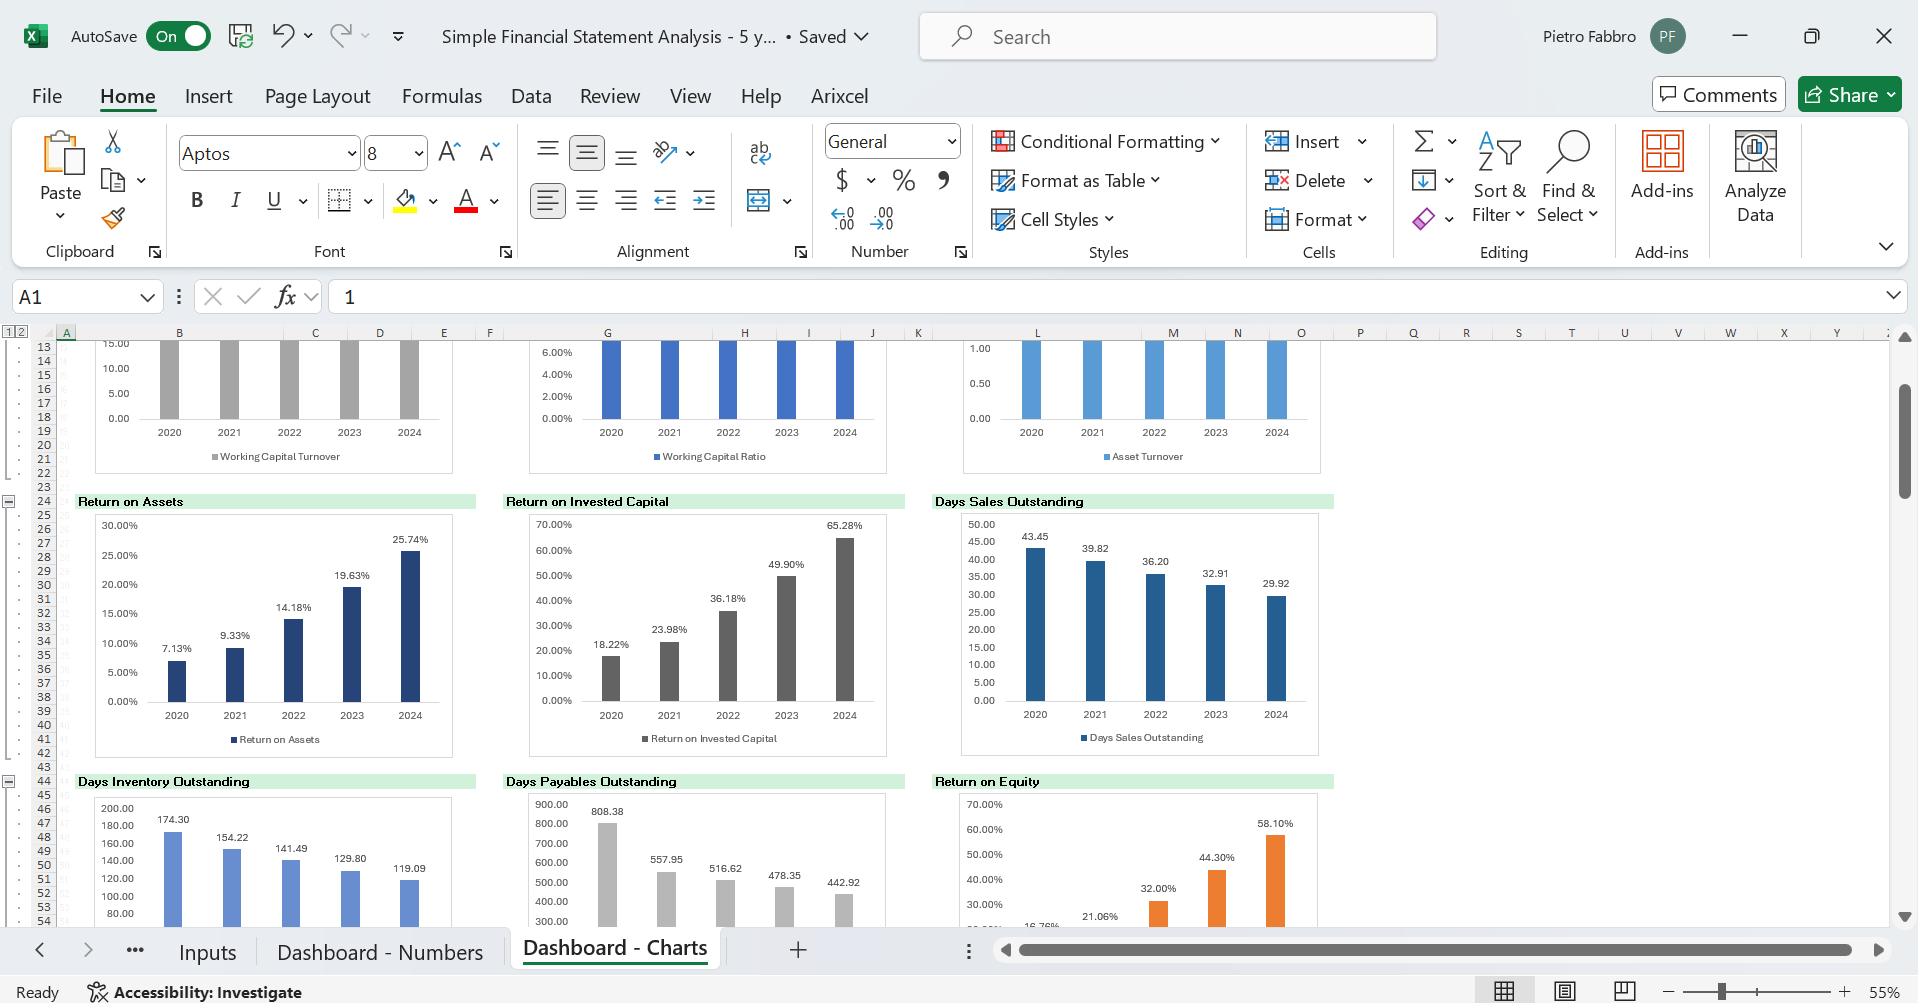
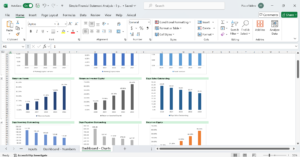
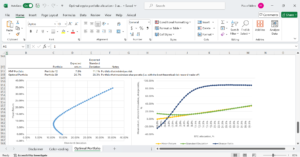
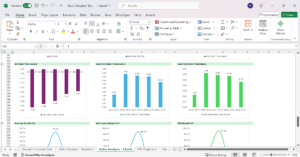
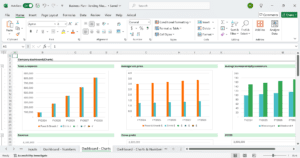
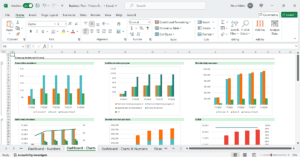
- Interactive Charts: Visualize your company’s financial data with a variety of customizable charts that provide clear, graphical representations of key financial metrics and ratios. These charts make it easier to communicate financial insights to stakeholders and facilitate data-driven decision-making.
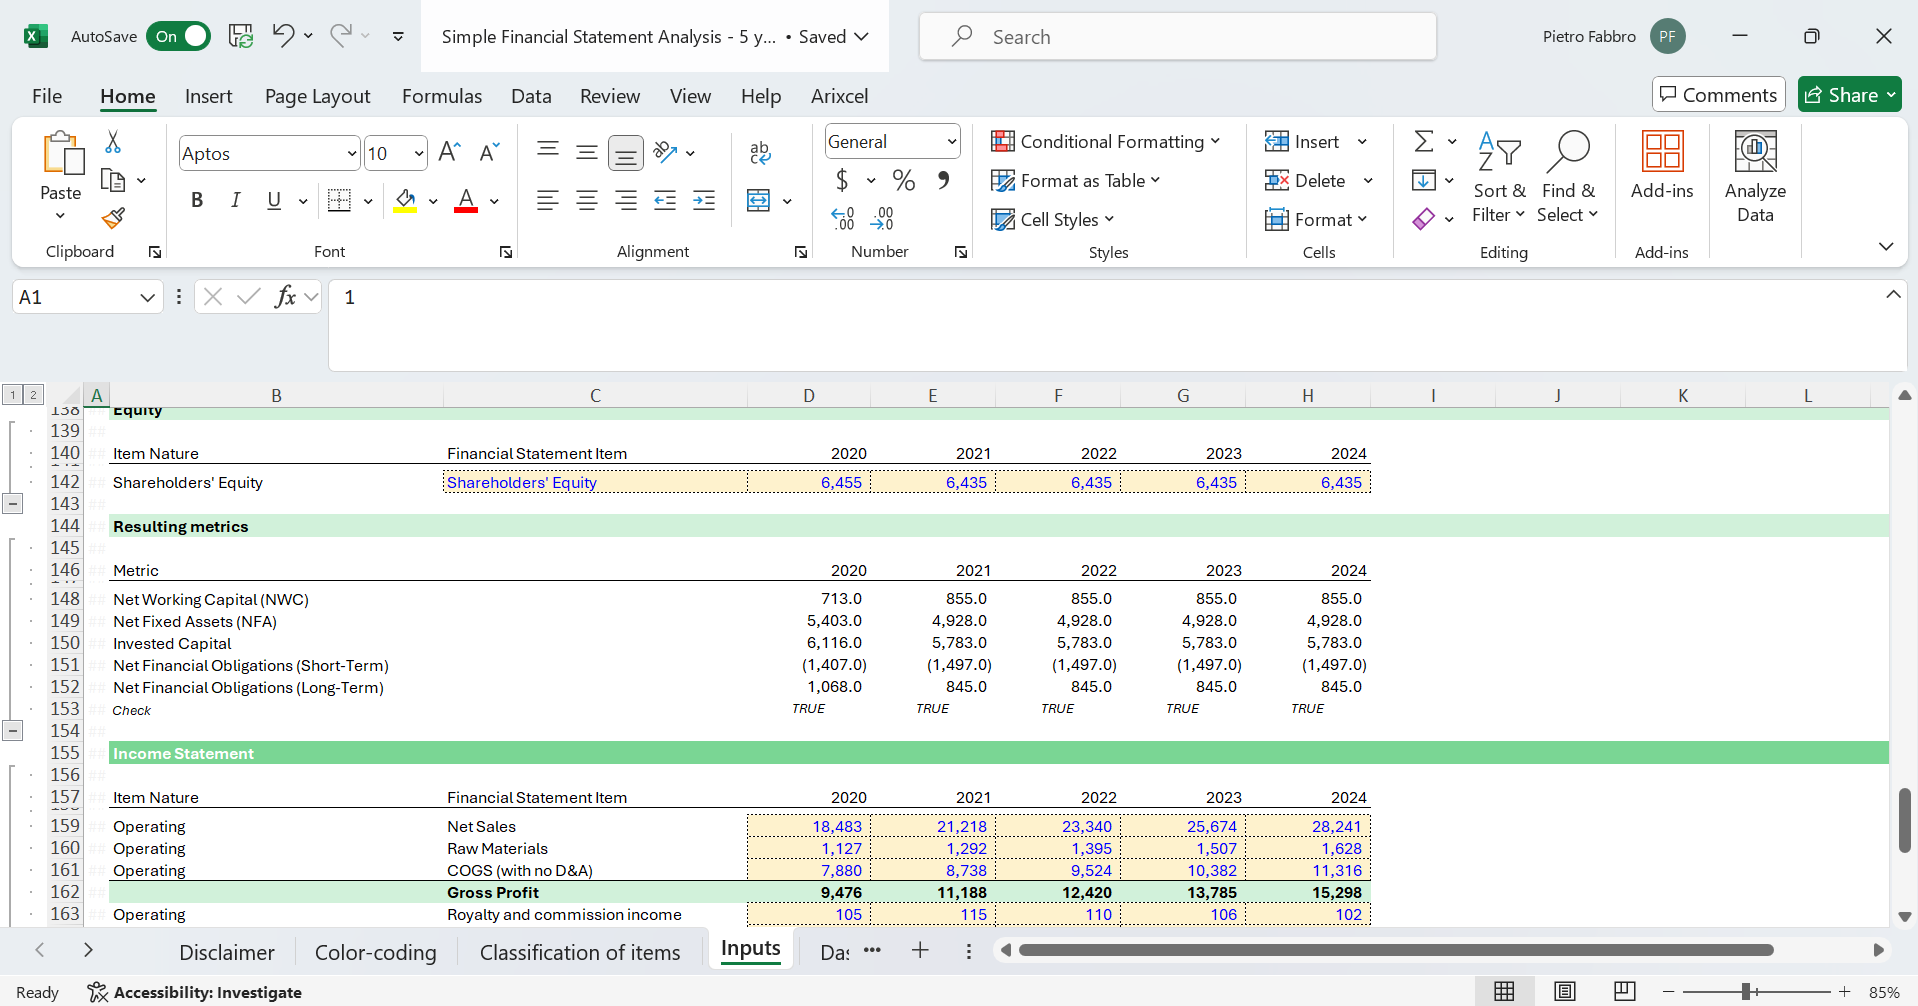
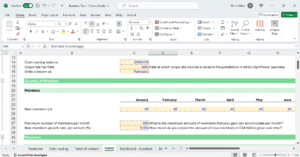
- Customizable Inputs: Input your financial data directly into the template, and the ratios and charts will be automatically updated. Adjust assumptions and modify the analysis to suit your specific business needs, making the template versatile for various industries and company sizes.
- Professional Reporting: Generate comprehensive financial analysis reports that are easy to understand and present to investors, stakeholders, or board members. The reports are designed to convey complex financial information in a clear and concise manner.
Benefits
- User-Friendly: Designed with clear instructions and built-in formulas to make financial modelling both efficient and straightforward.
- Professional Reporting: Produce polished financial reports to impress investors, lenders, and business partners.
Who is this template for?
- Business Owners and Managers: Gain a deep understanding of your company’s financial health and operational efficiency. This template is essential for making informed strategic decisions and improving financial management.
- Investors and Acquirers: Assess the financial stability and performance of potential investments with a reliable set of financial ratios and visualizations. This tool helps you make well-informed investment decisions.
- Consultants and Advisors: Provide your clients with expert financial analysis and insightful reports. This template is a valuable asset for delivering high-quality advisory services.
So much More
What’s Included?
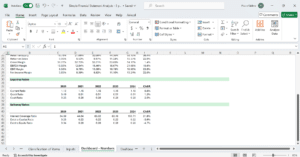
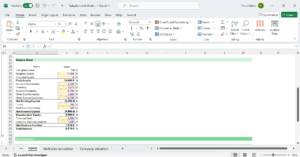
Pro-forma Financial Statements
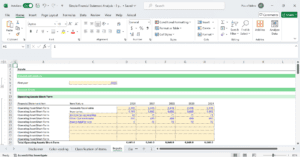
Historical Fundamental Data
Free email-support
Financial Ratio Analysis
Charts and dashboards
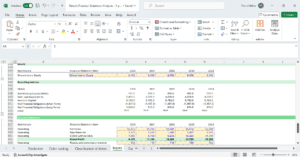
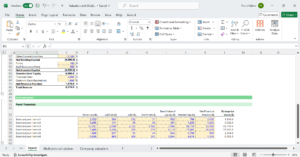
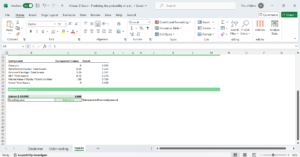
Business Valuation
5-Year Revenue and Costs Projection
Watch the Tutorial
Related Products
Related products
Reviewed by experts from leading organizations


Testimonials

Emma J
“I recently used one of their financial model templates to prepare for a major investor pitch, and it was a game-changer! The template was incredibly detailed and easy to customize. I secured the funding I needed, and I couldn't be happier with the results. Highly recommend!”

David K.
“The financial model templates are top-notch and developed by true professionals. It saved me countless hours of work, and the end result was a polished, accurate model that impressed my lenders. The only downside was the learning curve, but their customer support was very helpful.”
Maria L.
“As a small business owner, creating a financial model was daunting. These templates made it so much easier. Pietro was super helpful in helping me customizing the model and adapting it to my business. The final model was comprehensive and helped me secure a business loan effortlessly.”
John H.
“Excellent templates with detailed instructions. I found them very useful for creating my startup’s financial projections.”
Alex P.
“Great value for the price. The templates are comprehensive and user-friendly. I was able to secure funding for my project. Customer support was quick to respond to my questions, which was a big help.”
Laura T.
“I used them to prepare for a loan application, and my banker was impressed with the thoroughness and professionalism of my financials. Highly recommended!”
Alice R.
“These financial provided a clear, professional, and detailed financial overview that made a strong impression on investors and helped me raise the capital I needed for expansion.”
Hector F.
“I used a template to pitch my start-up to potential investors. Customer Support did a great job in helping me adapt the model to my business.”
Emily F.
“Highly recommend these financial model templates for anyone preparing to meet with investors.”