
Financial Projections
Break-Even Analysis: How to Determine Your Business’s Profitability
More than 50% of businesses fail within the first five years—not because they don’t have great products or services, but because they miscalculate their costs and pricing. Many business owners assume that as long as sales are coming in, they’re on the right track. But without knowing the exact point where revenue covers expenses, they could be running at a loss without realizing it.
That’s where break-even analysis comes in. Whether launching a new venture or scaling an existing one, understanding your break-even point is the difference between running a business that survives and thrives. This guide will show you how to calculate your break-even point, why it matters, and how to use it to make smarter financial decisions. If you’ve ever wondered, “Am I making money?”—you’re in the right place.
What Is Break-Even Analysis?

Break-even analysis determines the point at which your total revenue equals your total costs—meaning there’s neither profit nor loss. This is referred to as the break-even point (BEP). It provides insight into how much revenue you need to cover expenses and start generating profit.
Why Is Break-Even Analysis Important?
- Financial Planning: Helps businesses set realistic sales goals and budget efficiently.
- Pricing Strategy: Assists in setting product prices that ensure profitability.
- Investment Decisions: Guides funding and expansion choices with clarity.
- Risk Assessment: Identifies potential financial risks early to prevent losses.
- Operational Efficiency: Helps cut costs and optimize resource allocation for sustainable growth.
Break-even analysis is crucial for business owners, investors, and financial analysts as it enables informed decision-making and enhances long-term profitability.
Key Components of Break-Even Analysis
To perform a break-even analysis, you need to understand its key components:
- Fixed Costs: These are costs that do not change with the level of production or sales. Examples include rent, salaries, and insurance.
- Variable Costs: These costs vary directly with the level of production or sales. Examples include raw materials, packaging, and shipping.
- Total Costs: The sum of fixed and variable costs.
- Revenue: The income generated from sales of products or services.
- Break-Even Point (BEP): The point at which total revenue equals total costs.
The Break-Even Formula
The standard formula for calculating the break-even point in units is:
Break-Even Point (Units)=Fixed Cost / Selling Price per Unit−Variable Cost per Unit
Alternatively, you can calculate the break-even point in terms of sales revenue:
Break-Even Point (Sales Revenue)=Fixed Cost / 1−Variable Costs / Sales Revenue
Definitions:
- Fixed Costs: Costs that remain constant regardless of production levels (e.g., rent, salaries, insurance, depreciation, loan payments).
- Variable Costs: Costs that fluctuate with production levels (e.g., raw materials, direct labor, commission, shipping expenses).
- Selling Price per Unit: The price at which each unit is sold.
Example Calculation
Let’s consider a hypothetical business, XYZ Widgets, which manufactures and sells widgets. Here’s the data:
- Fixed Costs: $50,000 per year
- Variable Cost per Unit: $10
- Selling Price per Unit: $25
Using the formula:
Break-Even Point (Units)=50,000 / 25-10 = 50,000 / 15 = 3,333.33 units
This means XYZ Widgets needs to sell approximately 3,334 units to break even.
Step-by-Step Guide to Performing a Break-Even Analysis

- Step 1: Identify Fixed Costs: List all your fixed costs. These are expenses that remain constant regardless of your sales volume. Examples include:
- Rent or mortgage payments
- Salaries and wages
- Insurance premiums
- Depreciation of assets
- Step 2: Determine Variable Costs: Next, identify your variable costs. These costs fluctuate with your production or sales volume. Examples include:
- Raw materials
- Packaging
- Shipping and handling
- Sales commissions
- Step 3: Calculate Total Costs: Add your fixed and variable costs to determine your total costs. This will give you a clear picture of your expenses so you can break even.
- Step 4: Determine Your Selling Price per Unit: Your selling price per unit is the amount you charge for each product or service. This price should be set based on market research, competitor pricing, and your desired profit margin.
- Step 5: Apply the Break-Even Formula: Use the earlier formula to calculate your unit break-even point and sales revenue. This will give you a clear target to aim for.
- Step 6: Analyze and Interpret the Results: Once you’ve calculated your break-even point, analyze the results to understand what they mean for your business. Consider questions like:
- Is the break-even point achievable based on current sales trends?
- How can you reduce fixed or variable costs to lower the break-even point?
- What pricing strategies can you implement to improve profitability?
Practical Tips for Effective Break-Even Analysis
- Regularly Update Your Analysis: Your costs and pricing may change, so updating your break-even analysis to reflect current conditions is essential.
- Use Templates and Tools: Leverage templates and tools available on platforms like SHEETS.MARKET to simplify the process and improve accuracy. These resources can save you time and ensure that your calculations are correct.
- Scenario Analysis: Perform break-even analysis under different scenarios (e.g., best-case, worst-case, and most likely) to understand how cost changes or pricing could impact profitability.
- Monitor Key Metrics: Keep an eye on key financial metrics such as gross margin, net profit margin, and contribution margin to ensure your business remains on track to achieve its financial goals.
Case Study: Break-Even Analysis in Action
Emma is the financial analyst at TechGadgets Ltd., a company that sells wireless headphones. She calculated that the company’s fixed costs include rent, utilities, and administrative salaries, totaling $50,000 monthly. The variable cost per unit—covering materials, labor, and shipping—is $30 per headphone. The company sells each unit at a retail price of $80.
To determine the break-even point for TechGadgets Ltd.:
Break Even Quantity=fixed costselling price per unit – variable cost per unit
Break Even Quantity = $50,000 / $80 – $30 =$50,000 / $50 =1,000
Therefore, TechGadgets Ltd. must sell 1,000 wireless headphones monthly to break even.
Graphically Representing the Break-Even Point
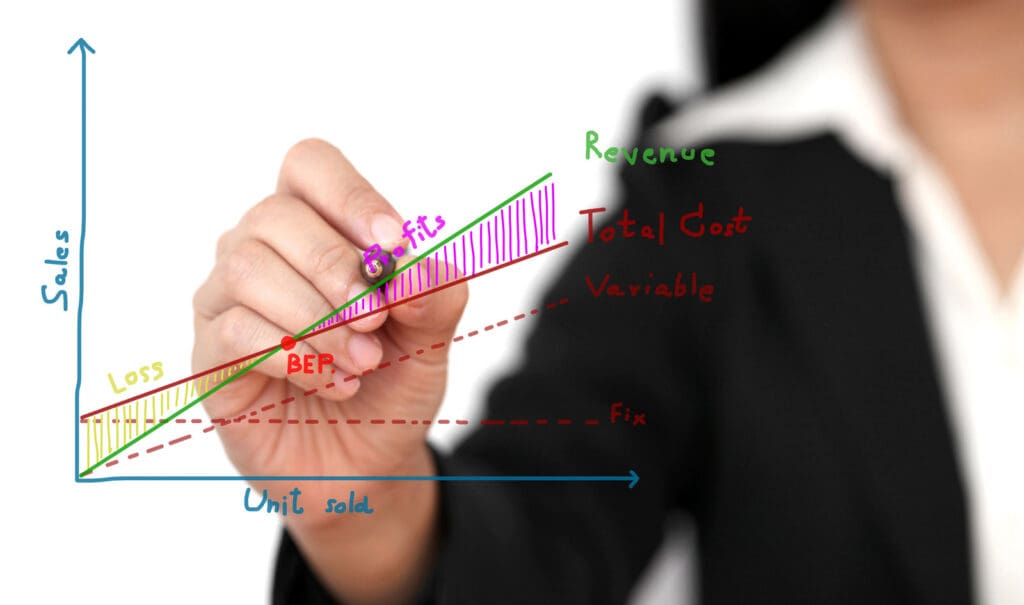
A break-even chart, called a Cost-Volume-Profit (CVP) graph, visually represents the unit sales and dollar revenue needed to cover total costs. Below is the CVP graph for the example above:

Explanation of the Break-Even Graph
- X-Axis (Horizontal): Represents the number of units sold.
- Y-Axis (Vertical): Represents the dollar amount ($), including costs and revenue.
- Red Line (Fixed Costs: $50,000): The company’s fixed expenses do not change with the number of units sold.
- Blue Line (Total Revenue): The income from selling units at $80 per headphone.
- Orange Line (Total Costs): The sum of fixed and variable costs at different sales levels.
- Break-Even Point (1,000 Units): At this sales level, revenue and total costs are equal ($80,000), meaning no profit or loss.
- Profit Area (Green): When sales exceed 1,000 units, revenue surpasses total costs, leading to profit.
- Loss Area (Red): If sales are below 1,000 units, total costs exceed revenue, resulting in a loss.
At 1,000 units sold, TechGadgets Ltd. neither makes a profit nor incurs a loss. Every unit beyond this point contributes directly to profit.
Common Mistakes & Misconceptions in Break-Even Analysis
Break-even analysis is a valuable tool for businesses to determine the point at which revenue equals costs, but several common mistakes and misconceptions can lead to inaccurate conclusions. Here are some of the most frequent errors:
1. Ignoring Variable Costs
- Mistake: Focusing only on fixed costs and neglecting variable costs.
- Impact: This can lead to underestimating the total costs and an incorrect break-even point.
- Solution: Ensure all variable costs (e.g., materials, labor, utilities) are included in the analysis.
2. Overlooking Fixed Costs
- Mistake: Assuming that fixed costs will remain constant over time.
- Impact: Fixed costs can change due to factors like inflation, rent increases, or changes in salary structures, leading to an inaccurate break-even point.
- Solution: Regularly review and update fixed costs in the analysis.
3. Assuming Linear Relationships
- Mistake: Assuming that costs and revenues will change linearly with production or sales volume.
- Impact: In reality, economies of scale, bulk discounts, or step-fixed costs can create non-linear relationships, making the break-even analysis less accurate.
- Solution: Use more sophisticated models that account for non-linear relationships when necessary.
4. Ignoring the Time Value of Money
- Mistake: Not considering the time value of money in long-term break-even analyses.
- Impact: This can lead to overestimating profitability, especially in projects with long payback periods.
- Solution: Incorporate discounted cash flow analysis for long-term projects.
5. Overestimating Sales Volume
- Mistake: Being overly optimistic about the sales volume needed to break even.
- Impact: This can lead to unrealistic expectations and poor business decisions.
- Solution: Use conservative estimates and conduct sensitivity analysis to understand the impact of different sales volumes.
6. Neglecting Market Conditions
- Mistake: Failing to consider external factors like market demand, competition, and economic conditions.
- Impact: The break-even point may be unrealistic if market conditions are unfavorable.
- Solution: Incorporate market research and competitive analysis into the break-even analysis.
7. Ignoring Product Mix
- Mistake: Not considering the impact of selling multiple products with different margins.
- Impact: The break-even point may be inaccurate if the product mix changes.
- Solution: Perform a weighted average contribution margin analysis for a multi-product business.
8. Assuming Constant Prices
- Mistake: Assuming that selling prices will remain constant over time.
- Impact: Price fluctuations due to competition, market demand, or cost changes can affect the break-even point.
- Solution: Regularly review and adjust prices in the analysis.
9. Overlooking Non-Financial Factors
- Mistake: Focusing solely on financial metrics and ignoring non-financial factors like customer satisfaction, brand reputation, and employee morale.
- Impact: These factors can indirectly affect sales and costs, impacting the break-even point.
- Solution: Consider both financial and non-financial factors in the overall business strategy.
10. Misinterpreting the Break-Even Point
- Mistake: Viewing the break-even point as a target rather than a minimum threshold.
- Impact: This can lead to complacency and a lack of ambition to achieve higher profitability.
- Solution: Use the break-even point as a baseline and set higher targets for profitability and growth.
11. Ignoring Seasonality
- Mistake: Not accounting for seasonal fluctuations in sales and costs.
- Impact: The break-even analysis may be inaccurate if it doesn’t reflect seasonal variations.
- Solution: Adjust the analysis for seasonality, using historical data to inform projections.
12. Failing to Update the Analysis
- Mistake: Using outdated data or assumptions in the break-even analysis.
- Impact: Changes in costs, prices, or market conditions can render the analysis obsolete.
- Solution: Regularly update the break-even analysis to reflect current conditions.
By avoiding these common mistakes and misconceptions, businesses can ensure that their break-even analysis is more accurate and useful for decision-making.
Conclusion: Take Control of Your Business’s Financial Future
Break-even analysis isn’t just a one-time calculation—it’s a strategic tool that helps you make informed pricing, cost management, and profitability decisions by knowing exactly when your business moves from loss to profit, you gain financial clarity and can plan for sustainable growth.
Ignoring these numbers can confuse you, leading to cash flow problems and unexpected losses. But when you integrate break-even analysis into your financial planning, you set your business up for long-term success. Regularly updating your calculations and using reliable tools can make the process easier and more accurate.
Crunching numbers manually is tedious; even minor miscalculations can lead to costly mistakes. SHEETS.MARKET simplifies break-even analysis with ready-to-use financial templates, allowing you to automate calculations, visualize key insights, and make data-driven decisions in minutes—without needing advanced Excel skills.
Want to stay ahead? Follow us on LinkedIn for expert tips, financial strategies, and exclusive updates that help you confidently scale your business.