Business Planning & Strategy, Financial Models
Vending Machine Business: Costs, Revenue Potential and Profitability
A vending machine business operates in a high-margin, semi-passive retail format where profitability depends on SKU velocity, location quality, and restocking efficiency. With low labor requirements and 24/7 revenue potential, the model is ideal for high-traffic zones, provided operators maintain tight COGS control, minimal stockouts, and centralized route management. Profit flows not from volume, but from structure.
Asset Configuration
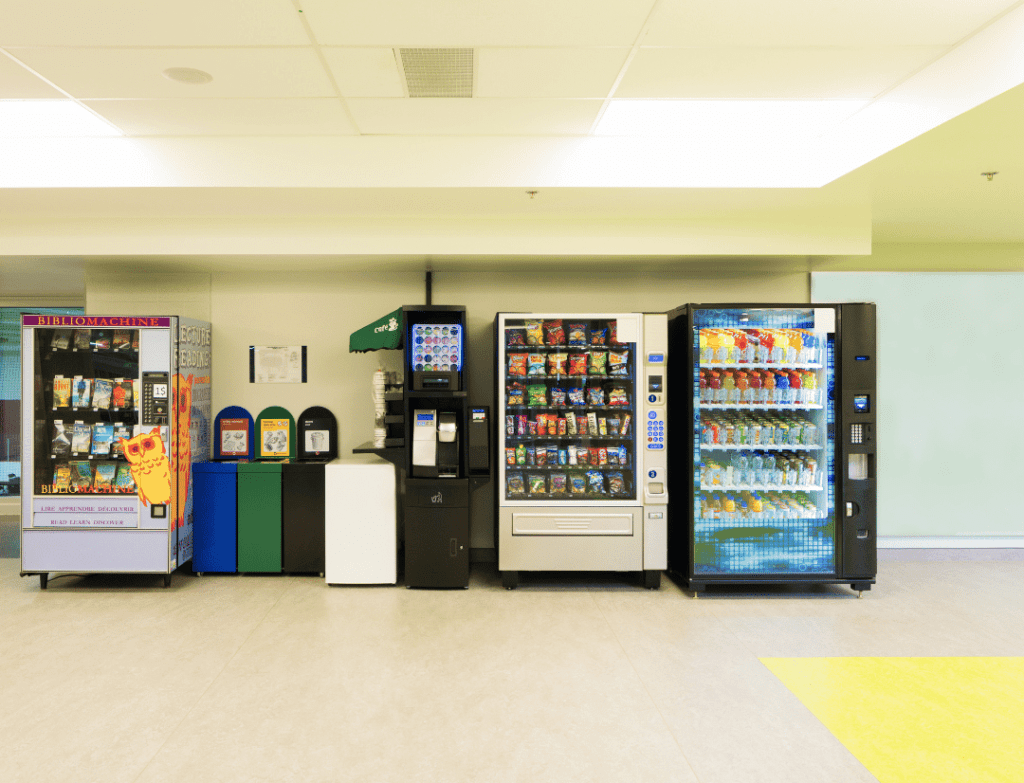
CapEx is low to moderate per unit, concentrated in hardware, payment systems, and initial inventory. A standard machine is placed in malls, schools, offices, gyms, airports, hospitals, or transport terminals.
| Asset Category | Cost Range (USD) | Notes |
|---|---|---|
| Vending Machine (new or refurbished) | 3,500 to 7,000 | Snack, beverage, or combo units with remote telemetry |
| Payment System (card, NFC, QR) | 800 to 1,500 | Multi-payment system, contactless preferred |
| Branding, Wraps, LED Display | 500 to 1,000 | Product visibility, location alignment |
| Setup, Transport, Permits | 500 to 1,000 | Placement approval, anchoring, electrical |
| Initial Inventory | 400 to 800 | Stock based on mix: chips, drinks, bars, health snacks, etc. |
Total CapEx: 5,700 to 11,300 USD per unit, depending on machine format, tech integration, and inventory breadth.
Revenue Model
Revenue is transaction-based. Average pricing ranges from 1.25 to 3.00 USD per item, depending on product type and venue. High-performing machines in transit-heavy or school zones drive strong daily volume.
Annual Revenue Potential for a Standard Snack/Drink Vending Machine in High-Traffic Location
| Revenue Stream | Volume Assumption | Annual Revenue (USD) |
|---|---|---|
| Snacks | 40 sales/day at 1.75 USD avg. | 25,550 |
| Beverages | 30 sales/day at 2.25 USD avg. | 24,638 |
| High-Margin Impulse (gum, mints) | 15 sales/day at 1.25 USD avg. | 6,844 |
| Total | 57,032 |
Top machines in airports, schools, and offices can generate 70,000 to 90,000 USD/year. Underperforming placements may yield 15,000 to 30,000 USD/year.
Operating Costs
Costs are low and predictable. COGS is typically 45 to 55 percent depending on SKU mix. Other major costs include rent/revenue share, restocking logistics, and maintenance.
| Cost Category | Annual Cost Range (USD) |
|---|---|
| Cost of Goods Sold | 25,000 to 31,000 |
| Rent or Revenue Share | 6,000 to 10,000 |
| Restocking Labor and Logistics | 5,000 to 7,000 |
| Machine Maintenance and Repairs | 1,000 to 2,000 |
| Payment Processing and System Licenses | 1,200 to 1,800 |
| Admin, Insurance, CRM | 500 to 1,000 |
| Total Operating Costs | 38,700 to 52,800 |
EBITDA = 57,032 – 38,700 to 52,800 = 4,232 to 18,332 USD per machine
EBITDA Margin = 7.4% to 32.1%
Well-placed, well-stocked machines with minimal rent and strong SKU mix can consistently achieve 25 to 35 percent margins. Poorly located or high-rent machines often struggle to break even.
Profitability Strategies
Profitability in the vending machine business depends on location economics, SKU margin stacking, and route efficiency.
Prioritize high-density, low-rent placements. Schools, gyms, and workplaces often offer free or low-fee access in exchange for convenience. Negotiate revenue-share over fixed rent, especially in variable-traffic zones.
Engineer SKU mix by margin and velocity. Optimize for high-frequency items like water, soda, and chips, but mix in high-margin niche items (e.g. protein bars, energy shots). Refresh SKU mix every 4 to 6 weeks based on sell-through data.
Track sales remotely and automate restocking logic. Machines with telemetry enable real-time inventory views. Target stockout rates under 5 percent, and consolidate restocking trips to hit 8 to 12 machines per route.
Upsell via bundling and cross-category promotions. Use pricing logic (e.g. combo deals: drink + snack at discount) to lift AOV. Promote digital loyalty (QR scan for points) to increase repeat purchases in workplaces or campuses.
Maintain machines proactively. Downtime kills revenue. Service machines weekly and perform quarterly audits. Schedule predictive maintenance on high-volume units to avoid mechanical failure during peak times.
So what?
A vending machine business is not a passive side hustle, it is a scalable, logistics-optimized, SKU-driven revenue model. Profitability is built through structured placement, high-margin product selection, and streamlined operations and not only by machine count. Operators who control costs, optimize restocking, and focus on location ROI can generate 7 to 32 percent EBITDA margins on 57,000 USD revenue per machine, with CapEx under 12,000 USD. In vending, volume enables scale but structure enables profit.

To effectively plan and manage your vending business, use a Vending Machine Financial Model from SHEETS.MARKET.
Looing for insights on an Automated Kiosk business instead? Here is our article!


