Business Planning & Strategy, Startup Finance
Automated Kiosk Business Model: Revenue Potential, Costs & Profitability
An automated kiosk business operates in a high-margin, semi-passive format where profitability depends on product margins, foot traffic conversion, and uptime efficiency. Whether the kiosk sells snacks, electronics, cosmetics, or phone accessories, success depends on location quality, SKU optimization, and inventory turnover, not sheer volume. The model scales horizontally through replication, not labor.
Asset Configuration
CapEx is moderate, focused on kiosk hardware, display systems, payment terminals, and initial inventory. Most units are placed in malls, airports, campuses, hotels, or large office buildings.
| Asset Category | Cost Range (USD) | Notes |
|---|---|---|
| Automated Kiosk Machine (hardware) | 15,000 to 25,000 | Touchscreen interface, secure vending mechanism, smart sensors |
| Payment System and Software | 3,000 to 6,000 | Card, QR, mobile wallet, remote pricing control |
| Branding, Wraps, Lighting, Signage | 1,500 to 3,500 | Exterior decals, LED lighting, product visibility |
| Setup, Transport, Permits, Wi-Fi | 2,000 to 4,000 | Initial setup, network, insurance, site fees |
| Initial Inventory | 5,000 to 10,000 | Depends on category: electronics, snacks, cosmetics, etc. |
Total CapEx: 26,500 to 48,500 USD per unit, depending on product category and branding investment.
Revenue Model
Revenue is transaction-based. Pricing power varies by vertical: higher-ticket items like phone accessories or electronics offer better margins than snacks. Volume is a function of foot traffic, dwell time, and visual appeal.
Annual Revenue Potential – Medium-Traffic Mall Kiosk (Electronics Accessories)
| Revenue Stream | Volume Assumption | Annual Revenue (USD) |
|---|---|---|
| Core Product Sales | 20 sales/day at 20 USD avg. | 146,000 |
| High-Margin Accessories (cables, cases) | 10 sales/day at 25 USD avg. | 91,250 |
| Impulse Items (chargers, lens kits) | 10 sales/day at 15 USD avg. | 54,750 |
| Total | 292,000 |
Top-performing kiosks in airports or premium malls can exceed 400,000 USD/year. Underutilized or low-traffic sites typically fall in the 100,000 to 180,000 USD/year range.
Operating Costs
COGS is category-dependent, ranging from 30 to 50 percent, with electronics yielding better contribution margins than FMCG. Labor is near zero, replaced by inventory restocking and maintenance cycles. Rent is the primary (fixed) cost lever.
| Cost Category | Annual Cost Range (USD) |
|---|---|
| Cost of Goods Sold | 100,000 to 150,000 |
| Rent / Revenue Share | 40,000 to 60,000 |
| Restocking Labor + Logistics | 12,000 to 18,000 |
| Maintenance and Hardware Support | 5,000 to 8,000 |
| Marketing, Signage Refresh, Promotions | 5,000 to 10,000 |
| Software, Admin, Data Plans | 4,000 to 6,000 |
| Total Operating Costs | 166,000 to 252,000 |
EBITDA = 292,000 – 166,000 to 252,000 = 40,000 to 126,000 USD
EBITDA Margin = 15.9% to 43.2%
Margins are highest in high-ticket or branded-product verticals with minimal theft and efficient refills. Snack-based kiosks often operate at lower margins due to tighter COGS and competition.
Profitability Strategies
Profitability in an automated kiosk business is driven by placement ROI, SKU velocity, and refilling efficiency.
First, optimize product mix by GMROI (gross margin return on inventory), not just unit movement. Eliminate low-margin or slow-turning SKUs monthly. Best-performing kiosks operate with under 50 SKUs total, 80% of which turn weekly.
Second, target RPSF (revenue per square foot) and revenue per kiosk per hour (RKH). If a unit produces under 15 USD per hour, it should be relocated or reformatted. Always negotiate rent as a revenue share when possible.
Third, integrate remote monitoring and predictive restocking. Track low-inventory alerts, automate refill routes, and bundle logistics across nearby sites. Target stockout rates under 3%, as lost sales erode margins quickly.
Fourth, use QR codes and digital ads to upsell. Promote bundled deals, seasonal flash sales, or loyalty opt-ins to drive repeat traffic. Digital interaction also reduces decision friction, especially for tech products.
Lastly, expand through hub-based territory scaling. Operate 5–10 kiosks within a 30-mile radius to optimize logistics and staff cycles, driving labor cost per unit down.
So what?
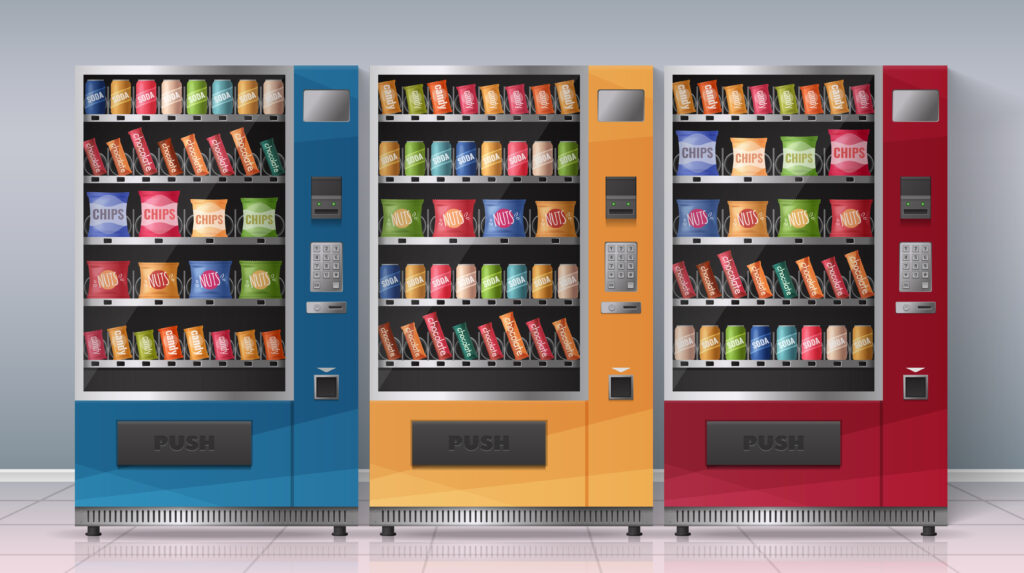
An automated kiosk is not a vending machine, it is a self-contained, margin-leveraged, foot traffic monetization system. Profitability stems from optimized product mix, location ROI, and operational control, not foot traffic alone. Operators who manage replenishment efficiency, tightly engineer SKUs, and select prime sites can achieve 16 to 43 percent EBITDA margins on 290,000 USD revenue per kiosk, with CapEx under 50,000 USD.

Launching and managing an automated kiosk business requires meticulous financial planning. Consider using the Automated Kiosk Financial Model Template from SHEETS.MARKET to simplify this process.


