Business Planning & Strategy, Financial Models
Sportswear Business: Costs, Revenue Potential & Profitability
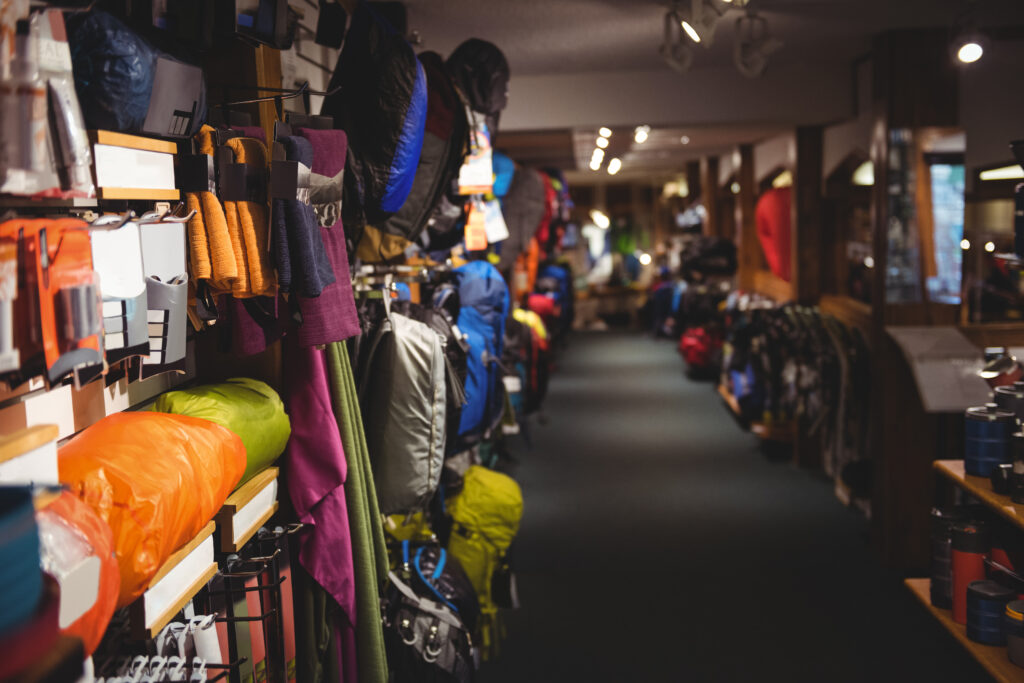
A sportswear store operates at the intersection of fashion, function, and identity, catering to both performance-driven athletes and lifestyle buyers. While gross margins are favorable, profitability is earned through product curation, brand tiering, and inventory turn discipline. Success in this category requires a strategic blend of aspirational branding, merchandising velocity, and multi-ticket upselling, not only SKU breadth.
Asset Configuration
CapEx is moderate, centered on retail presentation, storage, and point-of-sale infrastructure. A typical store occupies 800–2,000 sq. ft., balancing floor display with backstock to support high-SKU, multi-size inventory.
| Asset Category | Cost Range (USD) | Notes |
|---|---|---|
| Fixtures, Displays & Mannequins | $25,000 – $45,000 | Athletic-themed displays, slat walls, mannequins by sport/category |
| POS & Inventory Management Systems | $5,000 – $10,000 | Size/SKU tracking, CRM, loyalty integration |
| Branding, Lighting, Wall Graphics | $10,000 – $25,000 | Storefront visuals, illuminated logos, motivational messaging |
| Fitting Rooms & Storage Racks | $10,000 – $15,000 | 2–4 changing rooms, labeled shelving by category/size |
| Opening Inventory | $80,000 – $200,000 | Apparel, footwear, accessories, seasonal rotations |
Total CapEx: $130,000 – $295,000, depending on location size, store design, and inventory intensity. Co-branding or franchise agreements may include partial fixture subsidies.
Revenue Model
Revenue is transaction-based with an average basket of $50–$150, depending on mix of apparel, footwear, and accessories. Key margin drivers include bundled outfits, private label products, and limited edition or branded collaborations. Top-line growth is enhanced through loyalty programs, digital upsells, and seasonal campaigns.
Annual Revenue Potential for a 1,500 sq. ft. Urban Sportswear Store
| Revenue Stream | Volume Assumption | Annual Revenue (USD) |
|---|---|---|
| Apparel Sales | 22,000 transactions @ $55 avg. | $1,210,000 |
| Footwear | 7,000 transactions @ $90 avg. | $630,000 |
| Accessories (caps, bags, bottles) | $1,200/week avg. | $62,400 |
| Online / Click & Collect Orders | $3,000/week avg. | $156,000 |
| Customization & Group Sales | $50,000/year | $50,000 |
| Total | $2,108,400 |
Well-optimized urban locations or specialty stores (e.g., running, CrossFit, yoga) with digital support can exceed $2.5M–$3.5M/year. Generic or mall-saturated stores with no brand differentiation often struggle below $700K–$1M/year.
Operating Costs
COGS averages 50–55% depending on brand mix and private label penetration. Labor costs are modest, but rent and marketing are significant due to the need for visibility and brand positioning.
| Cost Category | Annual Cost (USD) |
|---|---|
| Cost of Goods Sold (COGS) | $1.05M – $1.16M |
| Staff Wages & Payroll Tax | $250,000 – $310,000 |
| Rent, Utilities, Insurance | $170,000 – $210,000 |
| Marketing, Sponsorships, Events | $85,000 – $125,000 |
| Shrinkage, Returns, Write-downs | $45,000 – $85,000 |
| Tech & E-Commerce Infrastructure | $40,000 – $60,000 |
| Total | $1.65M – $1.95M |
Efficient stores with high-margin brands, strong accessory attach rates, and low markdowns can sustain 18–22% EBITDA margins. Over-assorted, discount-reliant stores often fall below 10%.
Profitability Strategies
Sportswear profitability is driven by inventory control, multi-SKU basket building, and brand integrity.
Start with category curation: segment apparel and footwear by sport (e.g., running, training, yoga) and by function (performance vs. lifestyle). Use data to allocate shelf space based on GMROI (gross margin return on inventory), not only historical sales. Eliminate slow-moving SKUs quarterly.
Next, build outfit-driven sales behavior. Train staff to recommend coordinated apparel-footwear-accessory bundles with fixed price incentives (e.g., “Complete the Look – Save 15%”). Target multi-item conversion rates >35%.
Protect gross margin by limiting markdowns to final season weeks, and use loyalty rewards, not only discounts, to drive return traffic. Partner with micro-influencers and local gyms to promote new launches without degrading pricing.
Leverage private label lines for basics (e.g., socks, tanks, leggings) to achieve margins of 60–70%, and use seasonal brand exclusives (e.g., collabs with niche fitness brands) to drive hype-driven demand.
Digitally, tie e-commerce and in-store inventory to support real-time stock view, local pickup, and automatic replenishment. Use CRM data to promote new arrivals based on previous purchases by category, size, and brand affinity.
So what?
A sportswear store is not only about selling activewear- it’s about structuring brand-driven, inventory-yield retail that monetizes identity, performance, and repeat need. Profitability hinges on SKU discipline, per-visit monetization, and brand-tiered positioning. Operators who engineer basket size, manage margins at the category level, and layer in private label and community engagement can achieve 18–22% EBITDA margins on $2M–$3.5M revenue, with <$300K CapEx.

Are you considering opening your Sportswear business? Download the comprehensive Sportswear Business Financial Model Template from SHEETS.MARKET to simplify your financial planning. This tool will help you forecast costs, revenue, and potential profits, making securing funding and planning for success for your Sportswear Store business easier.


