
Бизнес-планирование и стратегия,Финансовые модели
Indoor Soccer Business: Costs, Revenue Potential & Profitability
Indoor soccer facilities operate within a capital-intensive, space-dependent industry where profitability hinges on throughput, scheduling efficiency, and service diversification. Despite consistent demand across youth, adult, and corporate segments, many operators underperform due to suboptimal capacity usage and limited monetization beyond hourly rentals. A disciplined, data-driven business model is essential to maximize ROI and reduce payback time.
Конфигурация активов
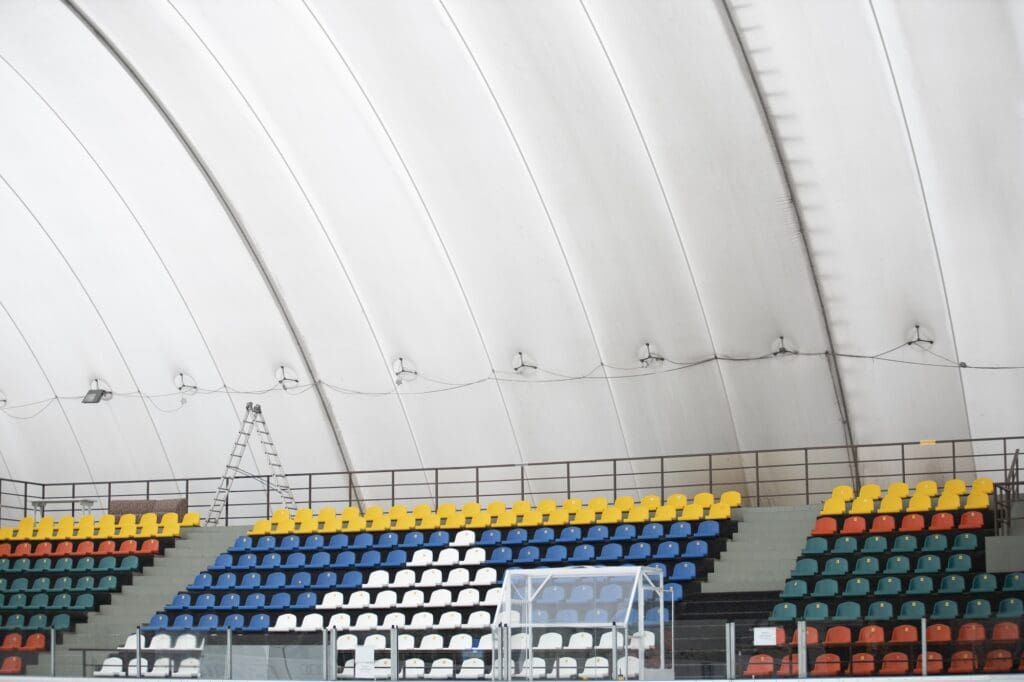
Capital expenditure is significant and driven primarily by facility size, field type, and building structure. A standard facility includes 1–3 turf fields, locker rooms, viewing areas, and a reception/admin zone. Total required area ranges from 25,000 to 60,000 sq. ft.
| Категория актива | Диапазон стоимости (долл. США) | Примечания |
|---|---|---|
| Turf Installation | $8 – $12 per sq. ft. | Includes sub-base, shock pad, turf |
| Field Netting & Goals | $25,000 – $60,000 | Per field |
| Lighting & HVAC | $100,000 – $200,000 | Dependent on ceiling height and climate zone |
| Locker Rooms & Admin Area | $75,000 – $150,000 | Includes check-in, restrooms, storage |
| Leasehold Improvements | $150,000 – $300,000 | Flooring, wall protection, viewing area |
| Equipment (Balls, Bibs) | $10,000 – $20,000 | One-time initial purchase |
Typical upfront CapEx ranges from $750,000 to $1.5M for a 2-field facility, including land/building acquisition. Converting existing warehouses offers significant CapEx advantages vs. ground-up construction.
Модель дохода
Revenue derives from field rentals, league registrations, tournaments, coaching programs, and ancillary services. Field rentals average $125–$200 per hour depending on city and time slot. With 2 fields operating 7 days a week at 60–70% utilization, annual rental income can exceed $500,000.
High-margin revenue streams such as youth leagues and coaching programs increase average revenue per hour. League registrations often yield $1,200–$1,500 per team per season (8–10 games), while group coaching classes generate $15–$30 per participant per session. Tournament weekends can drive 2x normal weekend revenue.
Annual Revenue Potential – 2-Field Facility, Suburban Market
| Поток доходов | Предположение об объеме | Годовой доход (долл. США) |
|---|---|---|
| Hourly Rentals | 2,800 hours @ $150 avg. | $420,000 |
| Youth & Adult Leagues | 120 teams @ $1,300 avg. | $156,000 |
| Coaching Programs | 200 students @ $600/year avg. | $120,000 |
| Tournaments (6/year) | $10,000 avg. per event | $60,000 |
| F&B and Vending | $500/week | $26,000 |
| Sponsorship/Advertising | Banner & jersey deals | $15,000 |
| Общий | $797,000 |
Well-run facilities with 3+ fields and integrated training academies can exceed $1M in annual revenue.
Эксплуатационные расходы
Labor, rent, and utilities represent the majority of fixed and variable operating costs. A lean model includes a general manager, 1–2 part-time staff per shift, and outsourced coaching staff compensated per session.
| Категория стоимости | Годовая стоимость (долл. США) |
|---|---|
| Труд | $160,000 – $200,000 |
| Аренда/лизинг | $140,000 – $200,000 |
| Utilities (Electric, HVAC) | $65,000 – $80,000 |
| Insurance & Permits | $25,000 – $40,000 |
| Техническое обслуживание и расходные материалы | $25,000 – $40,000 |
| Маркетинг и мероприятия | $20,000 – $30,000 |
| Admin, Booking, Software | $15,000 – $20,000 |
| Общий | $450,000 – $610,000 |
Well-optimized facilities achieve EBITDA margins of 25%+. Poorly utilized or overbuilt facilities fall below 10%, often driven by excessive rent or limited program depth.
Стратегии прибыльности
Revenue per field-hour (RevPFH) is the core profitability metric. The benchmark for a successful facility is $140–$160 RevPFH across a 12–14 hour daily window. Profitability increases materially with tighter scheduling (back-to-back games), higher off-peak usage (e.g., schools, senior groups), and multi-use field design (soccer, lacrosse, flag football).
Creating verticals such as academies, private training, and summer camps improves predictability and monetization per square foot. Selling memberships (e.g., discounted bookings, early registration) creates cash flow stability and reduces churn.
Operationally, leveraging booking software, automated lighting/HVAC control, and minimal on-site staffing during low-traffic hours reduces cost per hour of operation. Long-term leases (10+ years) with pre-negotiated escalations are critical to maintain rent as a fixed cost proportion.
Ну и что?
An indoor soccer facility is not a real estate play—it is a high-throughput service business. Success is driven by utilization, revenue density per hour, and repeatable programmatic offerings. A disciplined focus on scheduling, space monetization, and non-rental revenue is essential to reach 25%+ EBITDA margins. The difference between a break-even operation and a cash-generating asset lies in execution: structured pricing, diversified programs, and rigorous capacity management.
Are you considering opening your Indoor Soccer business? Download the comprehensive Indoor Soccer Financial Model Template от ЛИСТЫ.РЫНОК для упрощения вашего финансового планирования. Этот инструмент поможет вам прогнозировать расходы, доходы и потенциальную прибыль, упрощая получение финансирования и планирование успеха.