


Planificación y estrategia empresarial
How Much Does a Car Wash Make?
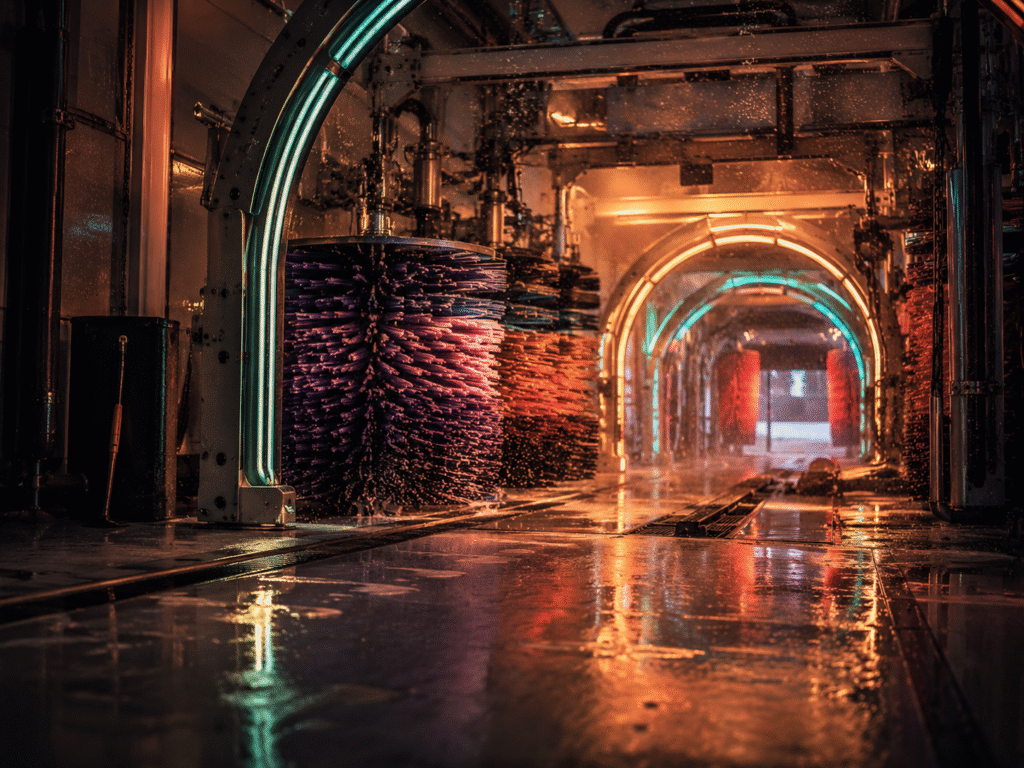
A car wash is a capacity business where profit is decided by throughput, membership penetration, and effective ticket, not by how many cars pass on the road.
The model works when site selection, pricing tiers, and recurring revenue are engineered together, because occupancy and equipment are structurally the dominant fixed cost and washed-car volume is structurally the dominant revenue line.
Most operators chase one-time washes and underbuild the membership base, which is why a site can be busy on Saturdays and still miss its numbers across the month.
The numbers below model a single-site express exterior tunnel in a US suburban or secondary urban market, the format now driving most industry growth.
Configuración de activos
The economic question is not “how advanced is the equipment,” it is “what annual fixed cost per car of capacity can the throughput carry.”
A value-engineered build keeps capital risk lower and shortens payback; a premium tunnel with deeper automation and water reclaim raises throughput and brand strength but adds fixed cost that traps margin when volume runs thin.
| Asset category | Value-engineered build (USD) | Premium build (USD) | What drives the number |
| Land acquisition | 200,000 to 600,000 | 800,000 to 2,000,000+ | Market, lot size, visibility |
| Site work, paving, drainage | 150,000 to 400,000 | 400,000 to 900,000 | Stacking lanes, water reclaim |
| Building shell, tunnel, canopy | 250,000 to 600,000 | 600,000 to 1,500,000 | Tunnel length, finish level |
| Tunnel equipment and conveyor | 300,000 to 700,000 | 700,000 to 1,400,000 | Throughput, automation, brand |
| Water reclaim and pumps | 60,000 to 150,000 | 150,000 to 350,000 | Local water regulation |
| Vacuums, POS, plate reader, gates | 80,000 to 180,000 | 180,000 to 400,000 | Membership automation depth |
| Permits, signage, working capital | 100,000 to 300,000 | 300,000 to 700,000 | Ramp speed, jurisdiction |
A value-engineered express site typically lands between 1.5 and 3.5 million; a premium build runs 3.85 to 10 million or more. Either way, fixed cost per car is the key stress test, because every dark hour in the tunnel is unrecoverable margin.
Formula: Annual fixed facility cost per car = (Occupancy + maintenance + utilities) / annual car count
Example: (220,000 + 60,000 + 63,000) / 90,000 = 3.81 per car
Each car must therefore clear far more than 3.81 in contribution to justify the asset.
Modelo de ingresos
In a well-run express tunnel, membership and wash revenue is the engine, commonly 90% or more of total revenue, with detailing and vending as minor lines. Memberships matter most, because members spend two to three times more annually than pay-per-wash visitors and now account for 40% to 60% of revenue at top sites.
Pricing context: express tickets average 10 to 15, with add-ons such as ceramic seal and tire shine pushing the effective ticket toward 15 to 20. Throughput ceilings sit near 50 to 60 vehicles per hour for a modern tunnel.
Core formulas:
Theoretical capacity = vehicles per hour × operating hours × operating days
Total wash revenue = (members × monthly fee × 12) + (retail washes × retail ticket)
Effective revenue per car = total wash revenue / total car count
Worked example for the single-site tunnel, assuming 50 vehicles per hour, 12 operating hours, and 360 days:
Theoretical capacity = 50 × 12 × 360 = 216,000 cars
At a realistic 41.7% utilization, annual car count = 90,000
Membership revenue = 1,500 members × 30 × 12 = 540,000
Member washes at roughly three per month account for 54,000 cars, leaving 36,000 retail washes at a 14 ticket = 504,000
| Revenue stream | Suposición | Annual revenue (USD) |
| Membership plans | 1,500 × 30 × 12 | 540,000 |
| Retail washes (incl. add-ons) | 36,000 × 14 | 504,000 |
| Detailing, vending, fleet, other | mixed | 36,000 |
| Total | 1,080,000 |
Effective revenue per car = 1,044,000 / 90,000 = 11.60 on wash revenue, the metric that exposes how heavy membership usage quietly drags the average below the retail sticker.
Costos de operación
Express tunnels are occupancy-and-equipment businesses with a thin variable layer. Labor runs 15% to 25% of revenue, far below the 30% to 40% of full-service models, which is why automation defends margin. Per-car consumables are small but unforgiving at volume: chemicals run 0.40 to 0.65 per car and utilities a similar band.
Start with the per-car variable layer.
Variable cost per car = chemicals + utilities + card processing per car = 0.50 + 0.70 + 0.26 = 1.46
Now cost the full operation.
| Cost category | Annual cost (USD) | Notas |
| Mano de obra | 195,000 | About 18% of revenue, semi-fixed |
| Occupancy (rent or debt service, property tax) | 220,000 | Dominant fixed line |
| Mantenimiento y reparación de equipos | 60,000 | Uptime protects revenue |
| Utilities (water and power) | 63,000 | Scales with car count |
| Marketing | 43,000 | About 4% of revenue |
| G&A, admin, contingency | 45,000 | Discipline matters |
| Productos químicos | 45,000 | 0.50 per car |
| Card processing | 23,000 | ~2.7% on ~80% non-cash sales |
| Seguro | 22,000 | Property, liability |
| Software and membership platform | 18,000 | Billing and retention engine |
| Total operating costs | 734,000 |
Profit math:
Operating surplus = Total revenue − Total operating costs
Operating surplus = 1,080,000 − 734,000 = 346,000
Operating margin = 346,000 / 1,080,000 = 32.0%
A healthy express operating margin sits in the 20% to 40% range, with top-tier sites reaching EBITDA margins above 40%. Industry-wide net margins average 15% to 18%, so anything below 20% on an express tunnel signals a volume or membership problem rather than a marketing one.
Break-even is where most operators fail to do the math before pouring concrete.
Contribution per car = effective revenue per car − variable cost per car = 12.00 − 1.46 = 10.54
Break-even cars = Fixed costs / contribution per car
With fixed costs of 603,000 (labor, occupancy, maintenance, marketing, G&A, insurance, software):
Break-even cars = 603,000 / 10.54 = 57,210 per year, or about 159 per day
Against 90,000 actual washes (250 per day), the site carries a 91-car daily cushion. Utilization makes that cushion visible.
Utilization rate = car count / theoretical capacity
Break-even utilization sits at 57,210 / 216,000 = 26.5%, against 41.7% actual.
The structural lesson is that an express tunnel breaks even on volume, then prints cash on every incremental car because variable cost per wash is barely a dollar and a half.
Estrategias de rentabilidad
These levers only work once the operating model is aligned: a site with real traffic, a tunnel sized for throughput, and a membership engine built before opening day.
The goal is to widen the spread between effective revenue per car and the tiny variable cost per car, then scale it through volume and recurring billing.
1. Treat throughput as the master lever
Equipment capacity sets the revenue ceiling, and operations decide how close you get to it.
Protect peak hours with queue design, attendant-managed loading, and license-plate recognition that moves members through without friction, because the 20 highest-volume hours each week carry most of the profit.
A tunnel idling at 40% utilization leaves the entire fixed base underused, so volume capture beats price increases every time.
2. Engineer membership penetration before chasing retail
Unlimited wash clubs convert weather-exposed, seasonal volume into contracted monthly revenue, and they lift lifetime value because members wash two to three times more often.
Target a member base large enough to cover fixed costs on subscription revenue alone, then let retail washes drop straight to contribution.
A site where memberships fund break-even is structurally defensible; one dependent on walk-in volume is exposed to the first rainy quarter.
3. Build ticket architecture that protects effective revenue
Sticker hikes trigger resistance, while tiered packages and add-ons expand revenue without resetting willingness to pay.
Convert ceramic seal, tire shine, and undercarriage treatments into default upgrades, since add-ons sold to 40% to 60% of customers raise the average ticket 25% to 35% at gross margins above 75%. Price the top wash tier to anchor the menu and pull retail buyers upward.
4. Run cost discipline on the per-car layer
Because consumables are small per wash but large at volume, metered chemical dosing and water reclaim move margin meaningfully.
Precision dosing extends drum life and trims per-car chemical cost, while reclaim cuts the utility line that scales with every vehicle.
On non-cash sales near 80% of revenue, shaving card processing from 3.0% toward 2.5% recovers tens of thousands annually with no operational change.
5. Defend margin through uptime and the labor model
Every hour the tunnel is down during peak operations is revenue you never recover, so preventive maintenance is a profit strategy, not an expense.
Staff to the express model, lean and cross-trained, and let automation absorb volume increases at near-zero incremental labor.
The structural advantage of the format is that throughput rises faster than headcount, so protect it by keeping equipment reliable and staffing tight.
¿Así que lo que?
A car wash can generate exceptional, recurring cash flow, but only when it is run as a capacity-and-membership business rather than a volume-of-cars business.
The practical path is to size the tunnel for throughput, build the membership base to cover break-even before counting a single retail wash, and hold the per-car variable layer near a dollar and a half, then target a sustainable 20% to 40% operating margin that funds maintenance and expansion.
The operators who win manage the spread between effective revenue per car and variable cost per car, hour by hour, across the highest-volume windows of the week.

If you want to estimate revenue, costs, and profit using real inputs (cars per day, average ticket, membership count, occupancy, and operating expenses), use a modelo financiero de lavado de autos to run the numbers fast.
